Destination Earth DESP Use Cases: DestinE Sea Ice Decision Enhancement (DESIDE) Software Verification and Validation Report SVVR
COMMENTS and ISSUES |
PDF This document is available in PDF format here. |
EUROPEAN SPACE AGENCY CONTRACT REPORT |
EOX IT Services GmbH |
- AMENDMENT HISTORY
-
This document shall be amended by releasing a new edition of the document in its entirety.
The Amendment Record Sheet below records the history and issue status of this document.Table 1. Amendment Record Sheet ISSUE DATE REASON 0.1
22/04/2024
Initial release for Review 1
1.0
22/04/2024
First released version
1.1
19/09/2024
Second released version
1.2
23/05/2025
RR3 version
1. Introduction
1.1. Purpose and Scope
This document represents the Software Verification and Validation Report (SVVR) for the DESIDE project 8482 with ESA contract 4000140320/23/I-NS. This document reports results of performing the generic regression/unit tests that are run on the software when new commits are performed to ensure the software is still functioning as expected described in the Software Verification and Validation Plan (SVVP).
1.2. Structure of the Document
- Chapter 2
-
This section provides an overview of the Destination Earth DESP Use Cases: DestinE Sea Ice Decision Enhancement (DESIDE).
1.3. Reference Documents
The following is a list of Applicable and Reference Documents with a direct bearing on the content of this document.
| Reference | Document Details | Version |
|---|---|---|
[SOW] |
Statement of Work Destination Earth DESP Use Cases selection - Round 1 |
1.0 |
[Proposal] |
Proposal No. 8482: DestinE Sea Ice Decision Enhancement (DESIDE) |
1.1 |
1.4. Terminology
The following terms have been used in this document.
| Term | Meaning |
|---|---|
Admin |
User with administrative capabilities on a platform. |
Code |
The codification of an algorithm performed with a given programming language - compiled to Software or directly executed (interpreted) within the platform. |
Discovery |
User finds products/services of interest to them based upon search criteria. |
Interactive Web Application |
An Interactive Application for analysis provided as a rich user interface through the user’s web browser. |
Key-Value Pair |
A key-value pair (KVP) is an abstract data type that includes a group of key identifiers and a set of associated values. Key-value pairs are frequently used in lookup tables, hash tables and configuration files. |
Object Store |
A computer data storage architecture that manages data as objects. Each object typically includes the data itself, a variable amount of metadata, and a globally unique identifier. |
Products |
EO data (commercial and non-commercial) and Value-added products. |
Software |
The compilation of code into a binary program to be executed within the platform on-line computing environment. |
User |
An individual using the services. |
Visualization |
To obtain a visual representation of any data/products held within the platform - presented to the user within their web browser session. |
Web Coverage Service (WCS) |
OGC standard that provides an open specification for sharing raster datasets on the web. |
Web Feature Service (WFS) |
OGC standard that makes geographic feature data (vector geospatial datasets) available on the web. |
Web Map Service (WMS) |
OGC standard that provides a simple HTTP interface for requesting geo-registered map images from one or more distributed geospatial databases. |
Web Map Tile Service (WMTS) |
OGC standard that provides a simple HTTP interface for requesting map tiles of spatially referenced data using the images with predefined content, extent, and resolution. |
Web Processing Services (WPS) |
OGC standard that defines how a client can request the execution of a process, and how the output from the process is handled. |
1.5. Glossary
The following acronyms and abbreviations have been used in this document.
| Term | Definition |
|---|---|
ADD |
Architecture Design Document |
AOI |
Area of Interest |
API |
Application Programming Interface |
COG |
Cloud optimized GeoTiff |
EO |
Earth Observation |
EOX |
EOX IT Services GmbH |
ESA |
European Space Agency |
FUSE |
Filesystem in Userspace |
ICD |
Interface Control Document |
JSON |
JavaScript Object Notation |
KVP |
Key-value Pair |
M2M |
Machine-to-machine |
OGC |
Open Geospatial Consortium |
PMP |
Project Management Plan |
REST |
Representational State Transfer |
SDD |
Software Design Document |
SFTP |
Secure File Transfer Protocol |
SRF |
Software Reuse File |
SRN |
Software Release Note |
SRP |
Software Release Plan |
SRS |
Software Requirements Specification |
SSH |
Secure Shell |
STAC |
Spatio-Temporal Asset Catalog |
SUM |
Software User Manual |
SVVP |
Software Verification and Validation Plan |
SVVR |
Software Verification and Validation Report |
TOI |
Time of Interest |
UMA |
User-Managed Access |
US |
User Story |
WCS |
Web Coverage Service |
WFS |
Web Feature Service |
WMS |
Web Map Service |
WMTS |
Web Map Tile Service |
WPS |
Web Processing Service |
WPS-T |
Transactional Web Processing Service |
2. Overview
Polar View Earth Observation Limited is working in collaboration with EOX IT Services, Drift+Noise Polar Services, the Danish Meteorological Institute, the Norwegian Meteorological Institute, and the Finnish Meteorological Institute to develop a fully functional Use Case that utilizes the DESP/DestinE system capabilities and data and adds value to meet the needs of policy and decision makers who require information on the past, current, and forecasted sea ice and other relevant conditions for operational purposes in the Baltic Sea, European Arctic Ocean, and the rest of the polar regions.
The Use Case will build on and complement existing operational and climate sea ice products and services including those provided by the Copernicus Marine Service, the national Ice Services, the ESA Polar Thematic Exploitation Platform (Polar TEP), and the commercial Drift+Noise IcySea app. The Use Case will augment and improve on the current offerings by:
-
Aggregating information of different types and from different sources to provide common products that span jurisdictional boundaries.
-
Producing new products that will improve the ability of users to make good decisions.
-
Making the products available in ways and means that are appropriate for the skills and requirements of different user communities.
One driver for the project is the regulation of the International Maritime Organization (IMO) of the United Nations mandating that ships operating in the polar regions meet certain requirements (the Polar Code). Among other things, the Polar Code specifies a range of information that ships traveling in polar waters are required to access for planning and operations. The Use Case will demonstrate the value of short and medium-term forecasts of sea ice, meteorological, and ocean conditions suitable for strategic and tactical decision making by ships and their owners.
A second driver for the project is the effect of climate change on polar conditions that will impact long-term planning and policy development for polar operations such as fishing, tourism, scientific research campaigns, oil and gas development, and supplying northern communities. The Use Case will deliver long-term forecasts of how changing sea ice and other conditions will affect where different types of ships will be able to travel in the polar regions compared to historical averages.
Benefits to polar operations and the rest of society will include increased safety of life and property, decreased pollution, and protection of sensitive environmental areas.
3. Verification activities
This section outlines the verification activities for key DESIDE components.
| Requirement | System Requirement ID | Description | Verification method |
|---|---|---|---|
DESIDE dashboard |
REQ01 |
The DESIDE dashboard is operational. |
Demonstration |
Polar TEP workspace |
REQ02 |
The Polar TEP workspace is operational |
Demonstration |
IcySea |
REQ03 |
The IcySea app is operational. |
Demonstration |
Climate Indicators |
REQ04 |
The climate indicators are accessible via the DESIDE dashboard for visualisation. |
Demonstration |
Baltic CMEMS Data |
REQ05 |
The available CMEMS data are accessible via the DESIDE dashboard for visualisation and in a Polar TEP workspace for processing. |
Demonstration |
Arctic DESP Data |
REQ06 |
The available DESP data are accessible via the DESIDE dashboard for visualisation and in a Polar TEP workspace for processing. |
Demonstration |
Arctic CMEMS Data |
REQ07 |
The available CMEMS data are accessible via the DESIDE dashboard for visualisation and in a Polar TEP workspace for processing. |
Demonstration |
Data Statistics |
REQ08 |
Data statistics for user selected regions of interest are accessible via the DESIDE dashboard for visualisation. |
Demonstration |
Harshness Index |
REQ09 |
The result calculating a harshness index is accessible via the DESIDE dashboard for visualisation. |
Demonstration |
Sentinel 1 Image Warping |
REQ10 |
The result of warping a Sentinel 1 image based on sea ice drift forecasts is accessible via the DESIDE dashboard for visualisation. |
Demonstration |
Structure Icing |
REQ11 |
The probability of structure icing is accessible via the DESIDE dashboard for visualisation. |
Demonstration |
POLARIS Risk |
REQ12 |
The risk to a ship from sea ice is accessible via the DESIDE dashboard for visualisation. |
Demonstration |
Sentinel 1 Image Interpretation |
REQ13 |
ML interpretation of sea ice characteristics from Sentinel 1 images is accessible via the DESIDE dashboard for visualisation. |
Demonstration |
RCM Data |
REQ14 |
The available RCM data are accessible via the DESIDE dashboard for visualisation and in a Polar TEP workspace for processing. |
Demonstration |
Sea Ice Charts |
REQ15 |
The available sea ice charts are accessible via the DESIDE dashboard for visualisation, in a Polar TEP workspace for processing, and usable by the POLARIS algorithm. |
Demonstration |
4. Results of verification activities
This section describes results of testing activities described in the Software Verification and Validation Plan (SVVP).
4.1. REQ01 DESIDE Dashboard
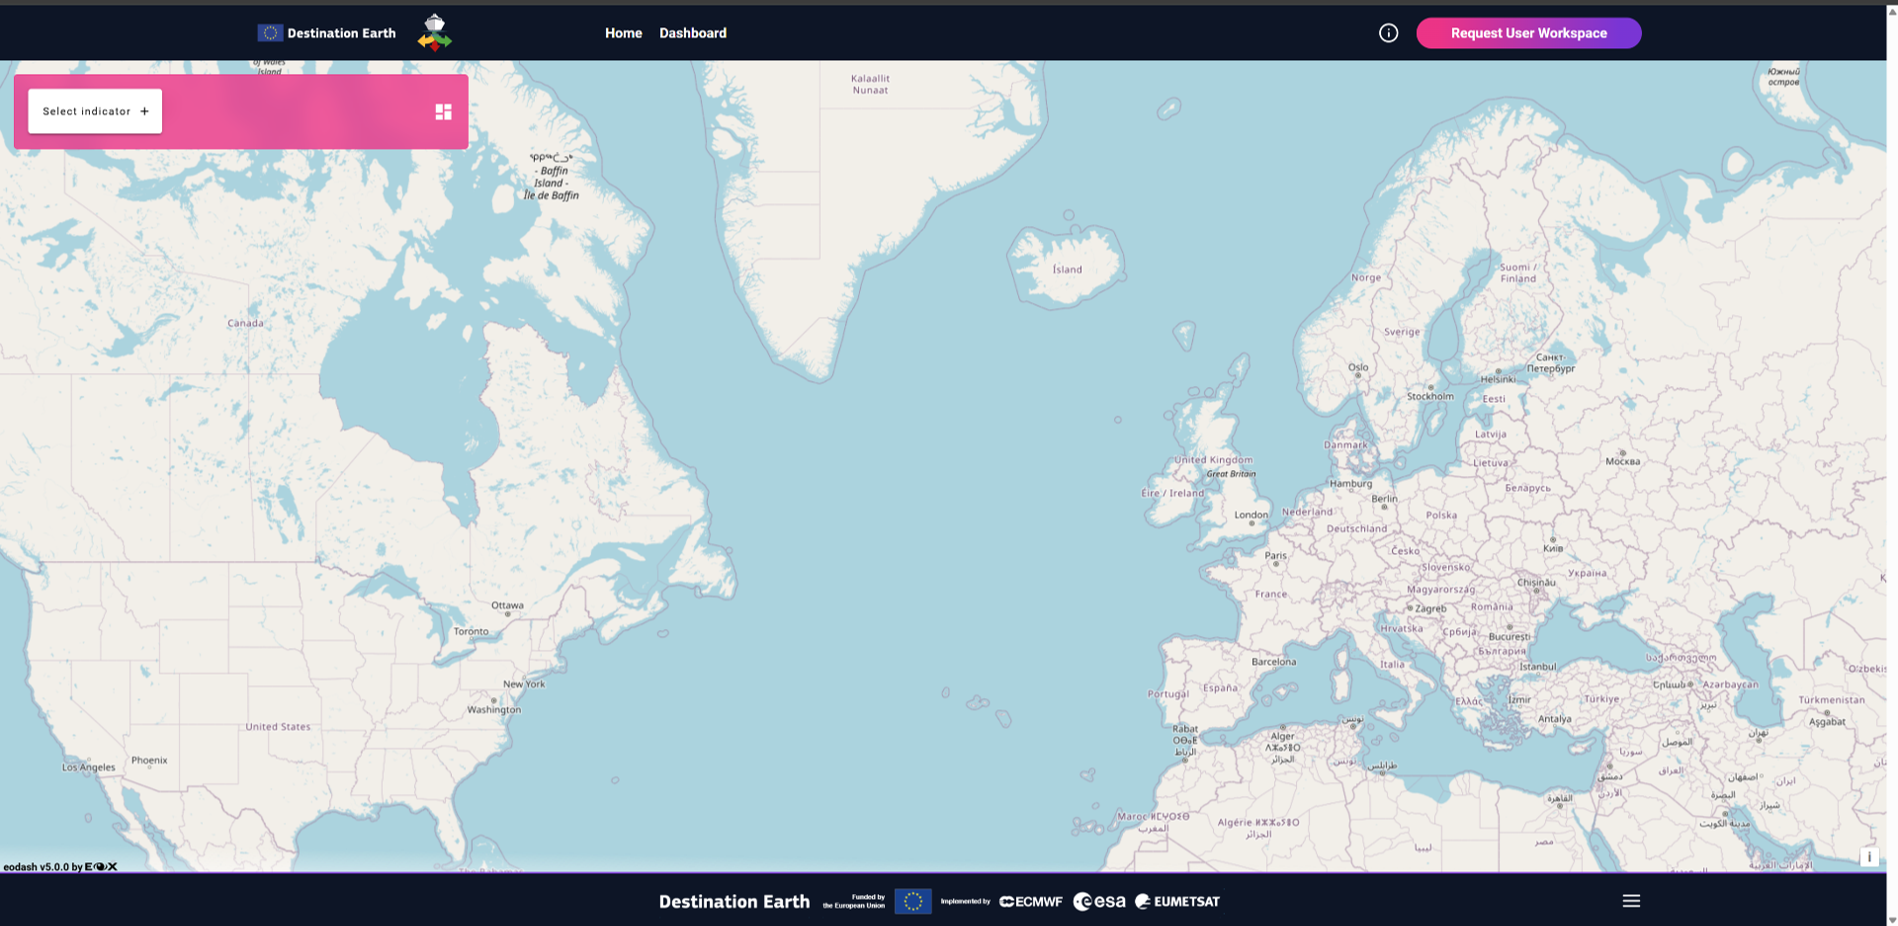
Requirement: The DESIDE Dashboard is operational.
Verification: Demonstration at https://deside.polarview.org/ and selecting "Dashboard" or at https://deside.eox.at. Select "Dashboard" in the main menu.
4.2. REQ02 Polar TEP
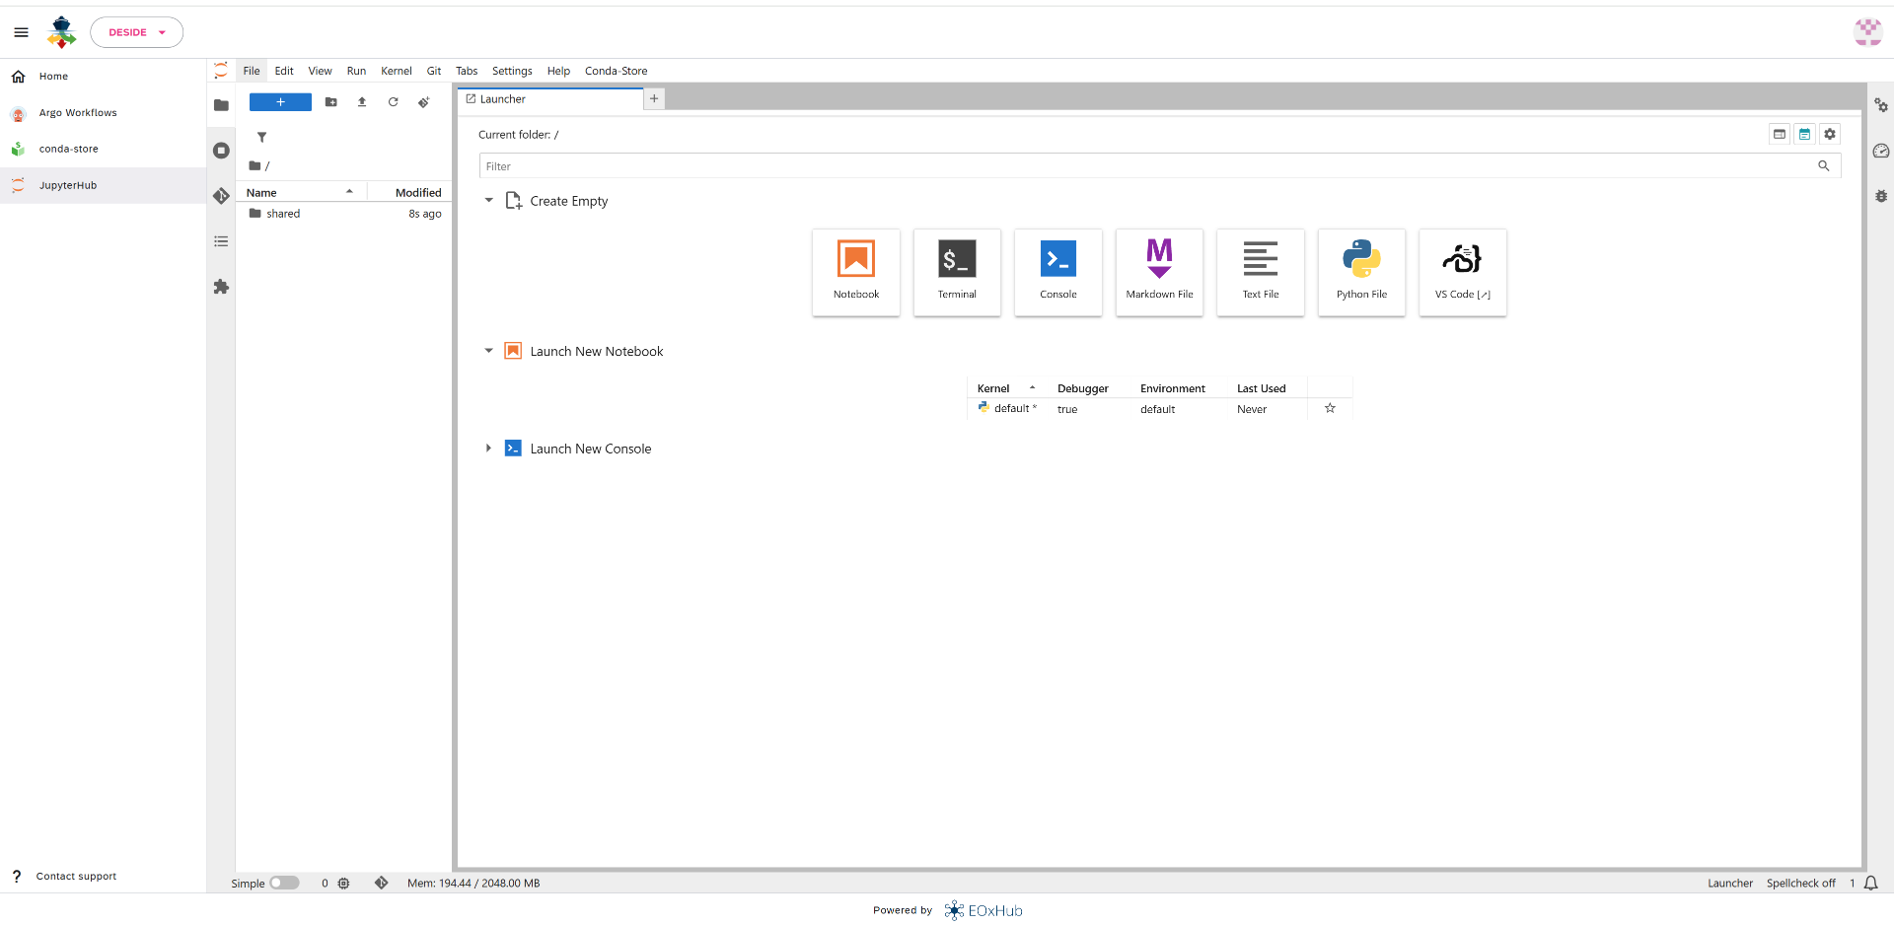
Requirement: The Polar TEP workspace is operational.
Verification: Demonstration at https://deside.polarview.org/ and selecting "Polar TEP" or at https://deside.eox.at and selecting "Request User Workspace" in the main menu.
Instructions for accessing CMEMS datasets from Destination Earth Data Lake showing how to download and visualize the data in a Polar TEP IDE:
4.3. REQ03 IcySea
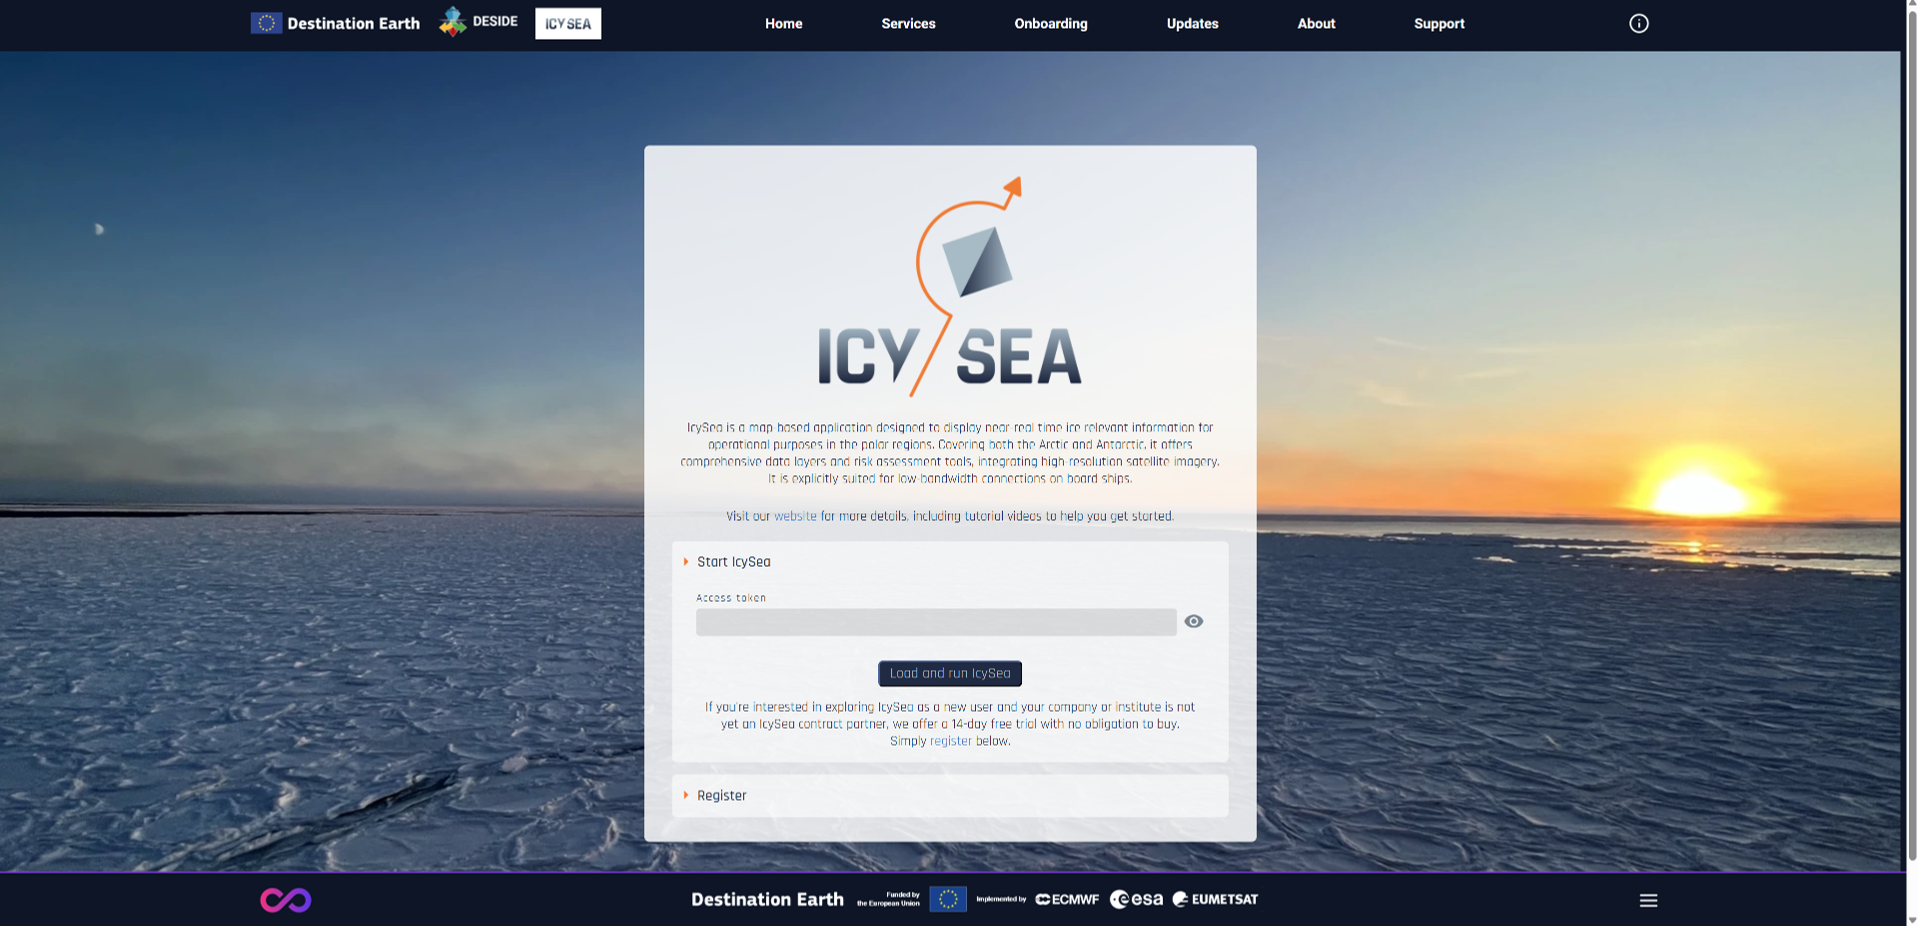
Requirement: The IcySea app is operational.
Verification: Demonstration at https://icysea.app/deside.html
4.4. REQ04 Climate Indicators
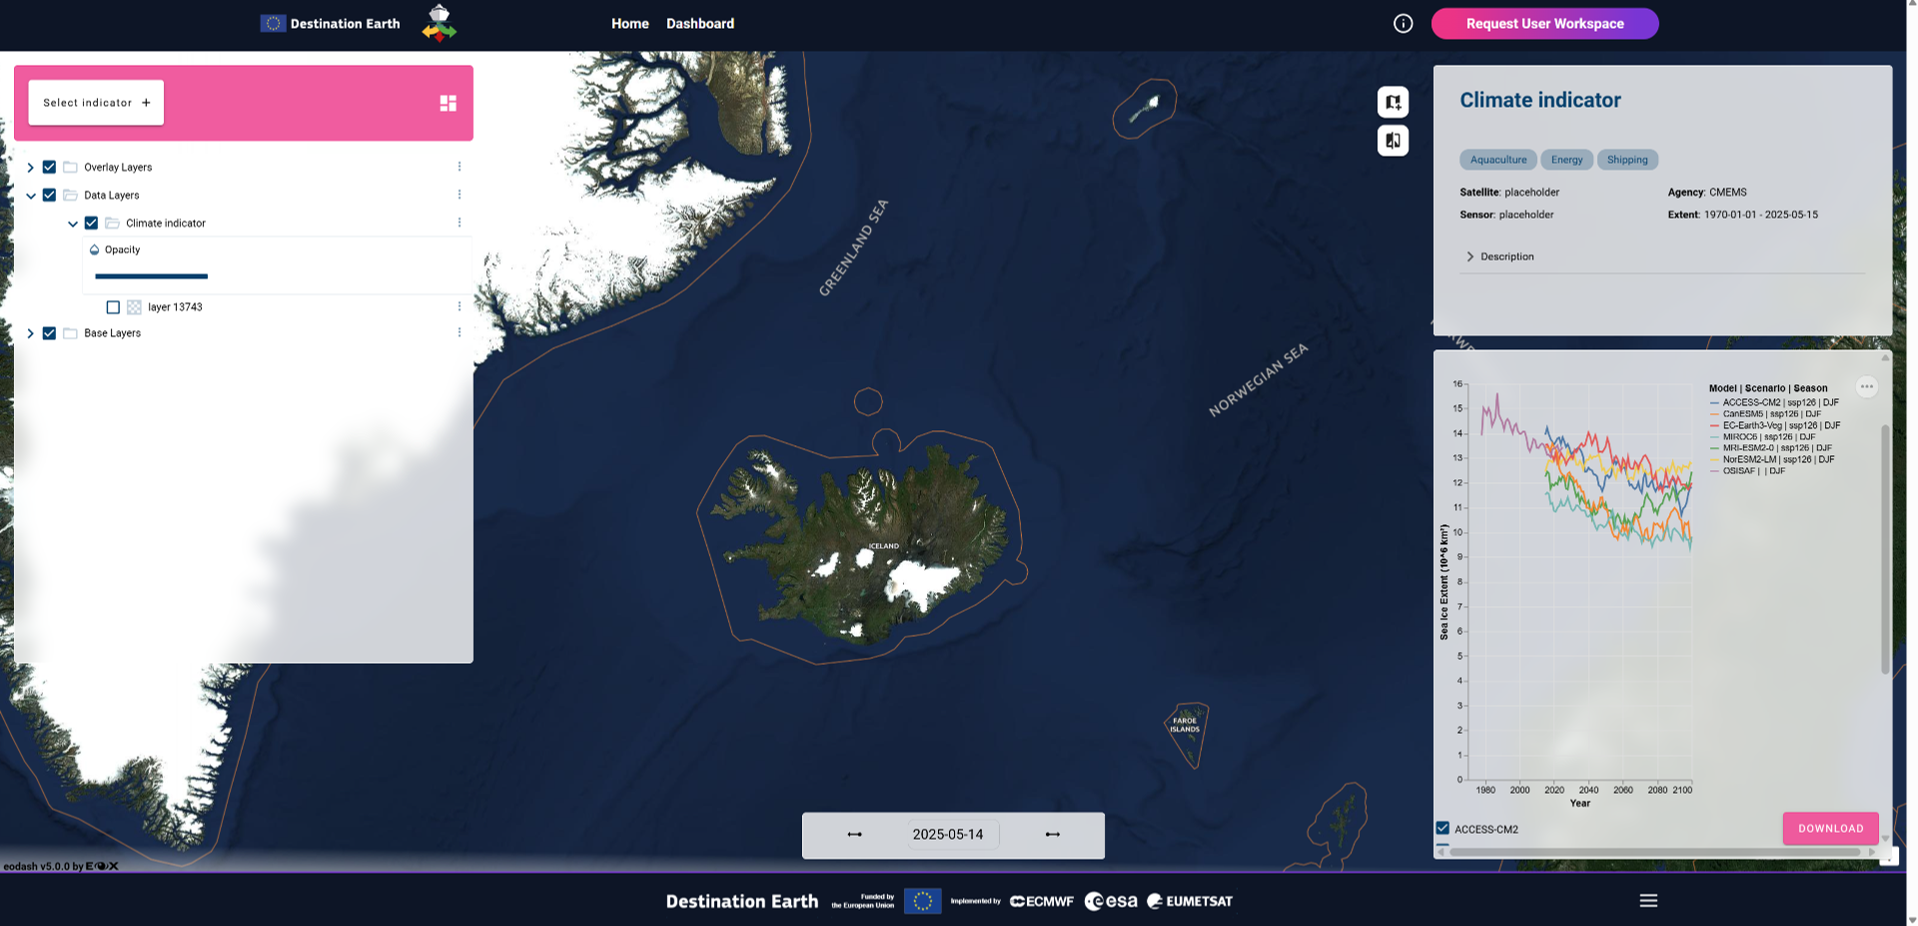
Requirement: The climate indicators are accessible via the DESIDE dashboard for visualisation.
Verification: Demonstration by selecting "Select indicator +" and then "Climate Indicator" under the "Capabilities" submenu. The climate indicator graph is shown in the bottom right window. Different models, scenarios, and timeframes can be selected. The"…" menu provides options to download a picture of the graph or access the graph in the Vega Editor.
4.5. REQ05 Baltic CMEMS Data
Requirement: The available CMEMS data are accessible via the DESIDE dashboard for visualisation and in a Polar TEP workspace for processing.
Verification: Demonstration in preparation.
4.6. REQ06 Arctic DESP Data
Requirement: The available DESP data are accessible via the DESIDE dashboard for visualisation and in a Polar TEP workspace for processing.
Verification: Demonstration in preparation.
4.7. REQ07 Arctic CMEMS Data
Requirement: The available CMEMS data are accessible via the DESIDE dashboard for visualisation and in a Polar TEP workspace for processing.
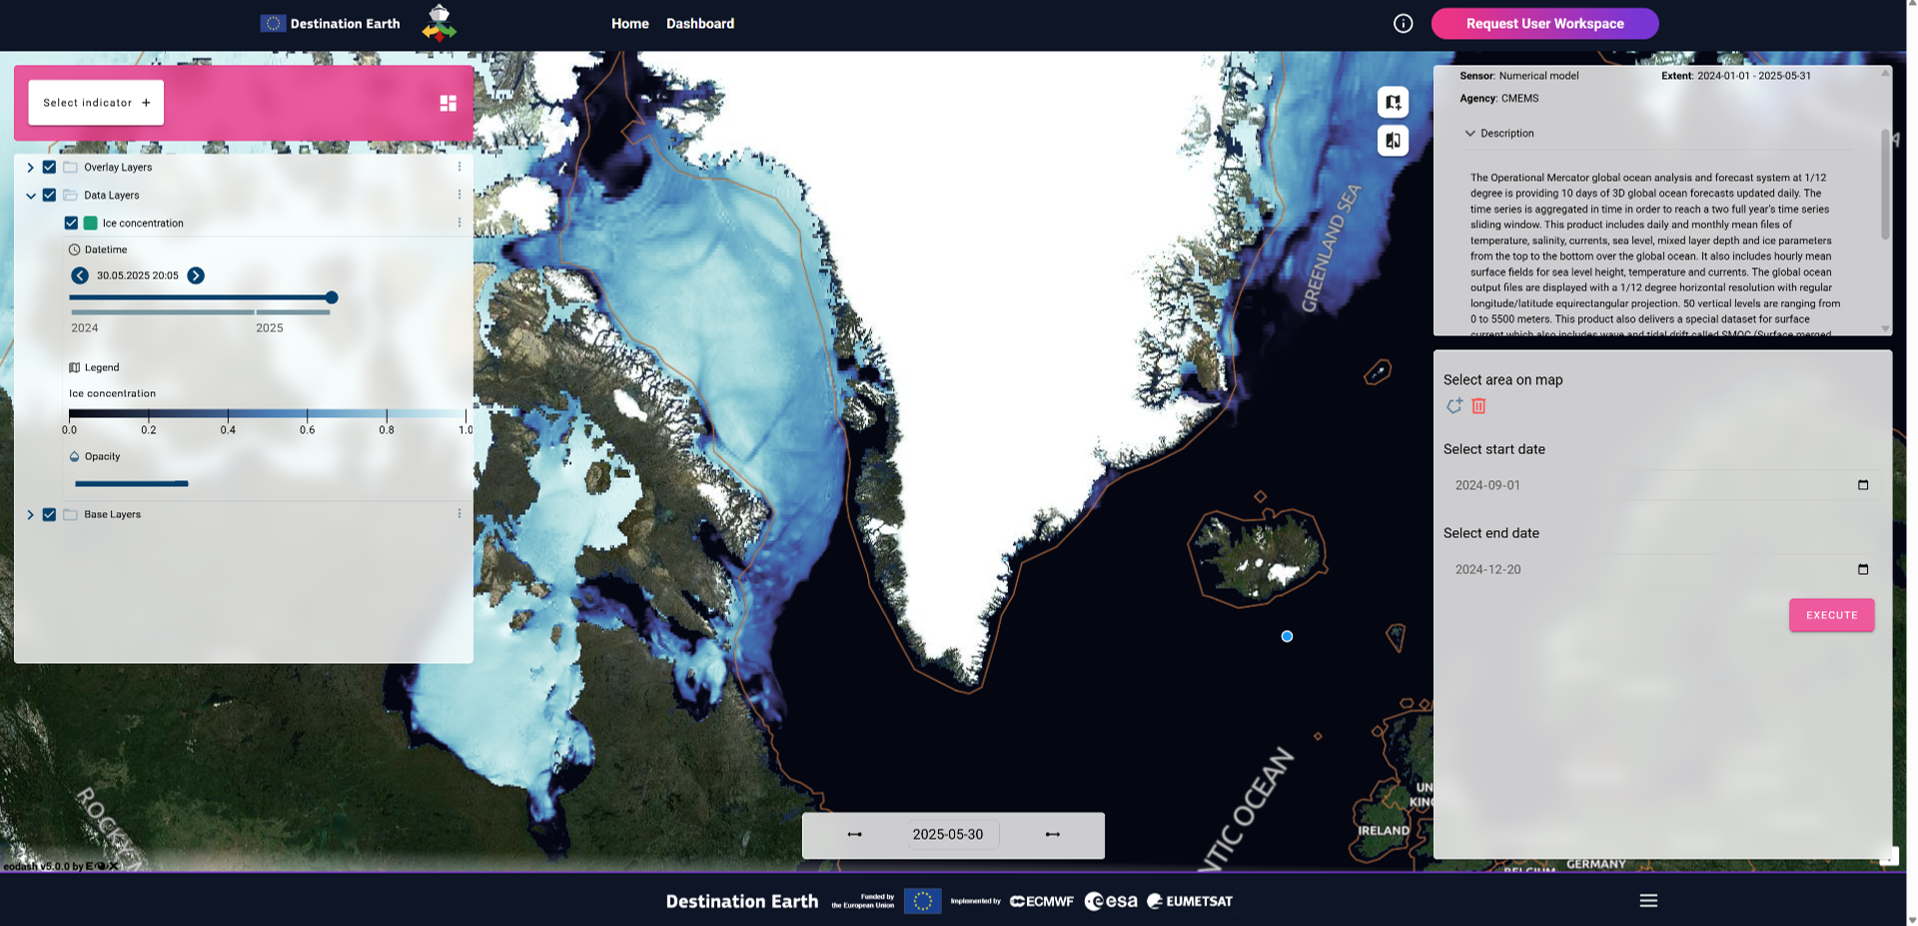
Verification: Demonstration by selecting "Select indicator +" and then any data variable. The window on the top left shows the legend and allows selection of the date and the layer opacity. The figure below shows "Ice Concentration".
4.8. REQ08 Data Statistics
Requirement: Data statistics for user selected regions of interest are accessible via the DESIDE dashboard for visualisation.
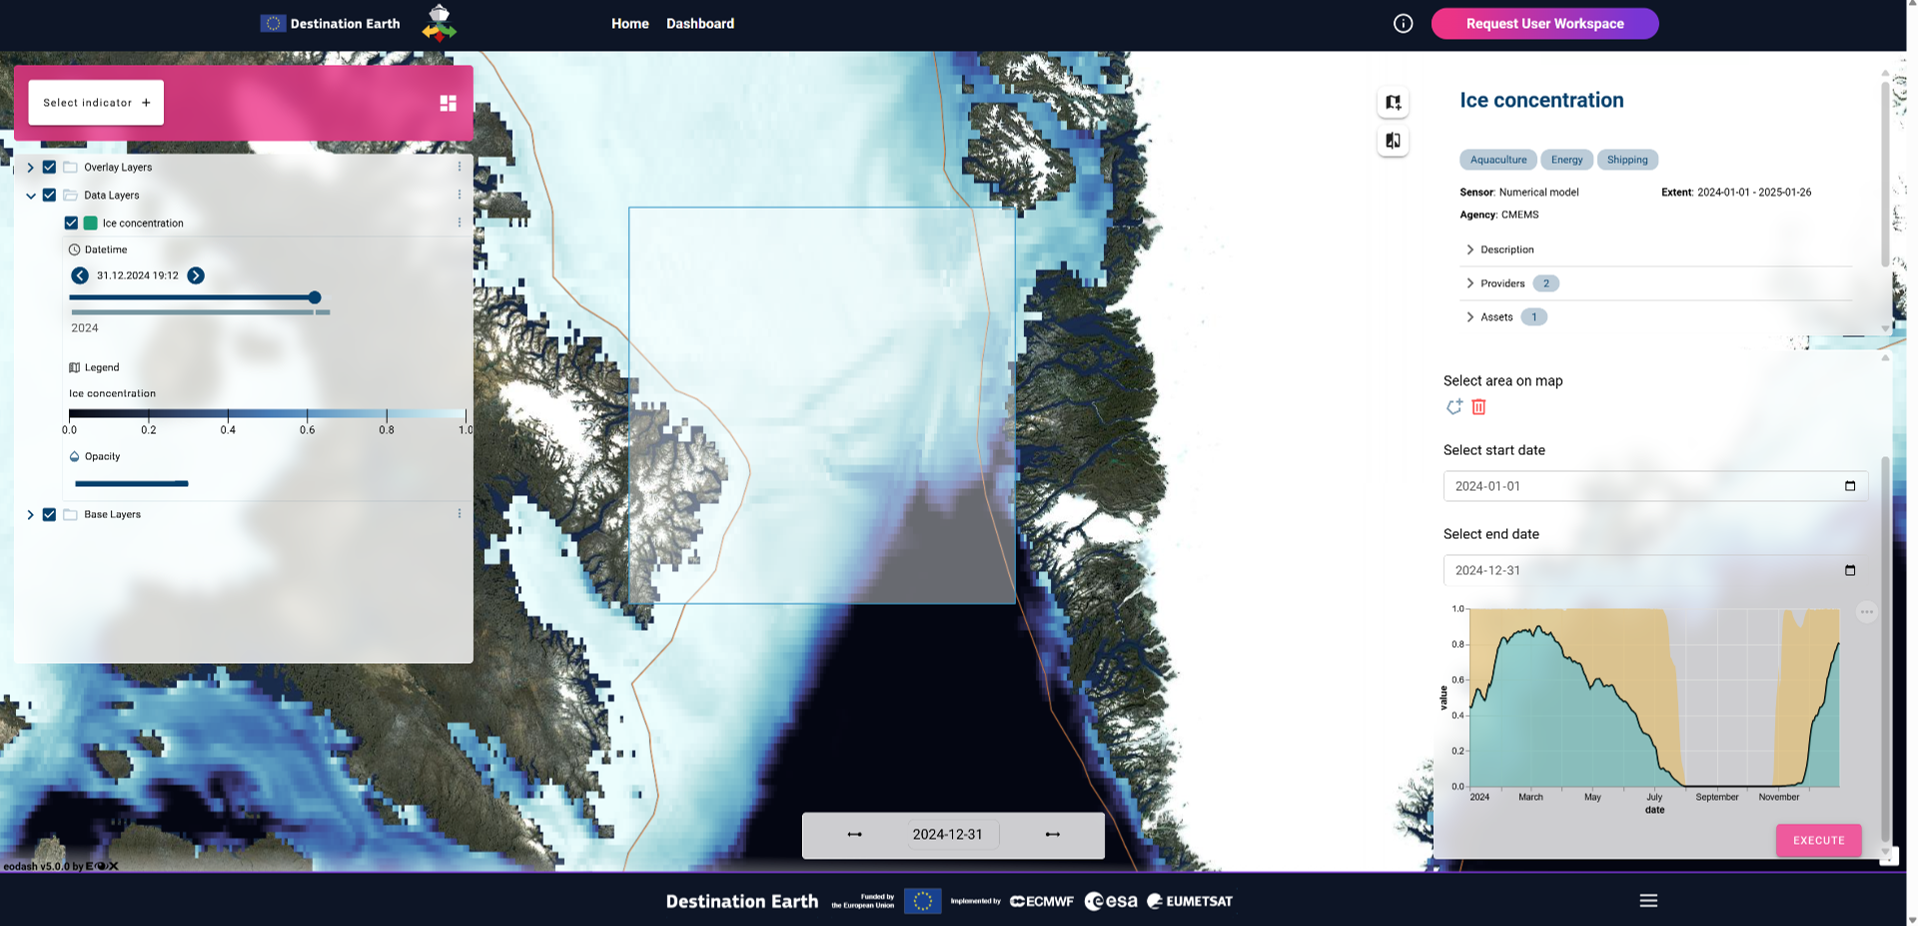
Verification: Demonstration by selecting "Select indicator +" and then any data variable. Draw a region of interest using the cursor. Select start and end dates in the bottom right window. Click on the "Execute" button in the bottom right window. The data is graphed and individual statistics can be seen by hovering over the graph. The figure below shows "Sea Ice Concentration".
4.9. REQ09 Harshness Index
Requirement: The result of calculating a harshness index is accessible via the DESIDE dashboard for visualisation.
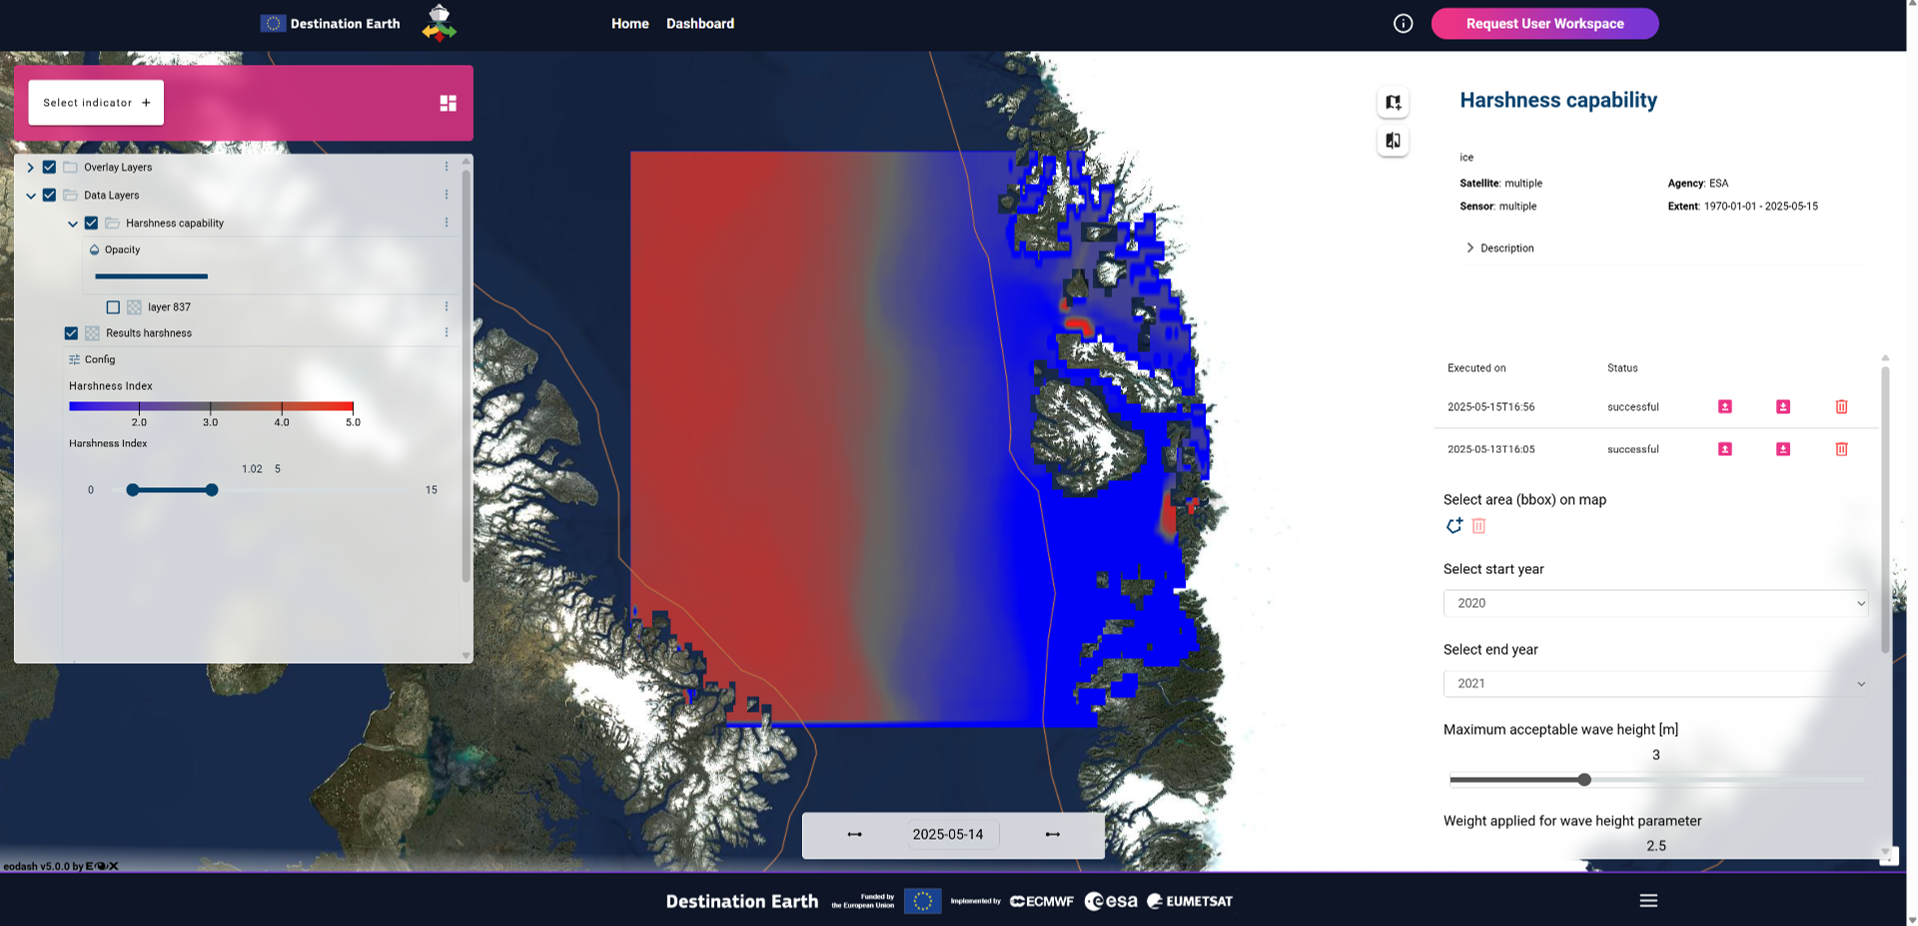
Verification: Demonstration by selecting "Select indicator +" and then and then "Harshness Capability" under the "Capabilities" submenu. Select a region of interest. Adjust the parameter values and weights using the slide bars in the bottom right window. Click on "Execute". Previous runs are available for retrieval. The window on the top left shows the legend and allows selection of the the layer opacity.
4.10. REQ10 Image Warping
Requirement: The result of warping a Sentinel 1 image based on sea ice drift forecasts is accessible via the DESIDE dashboard for visualisation.
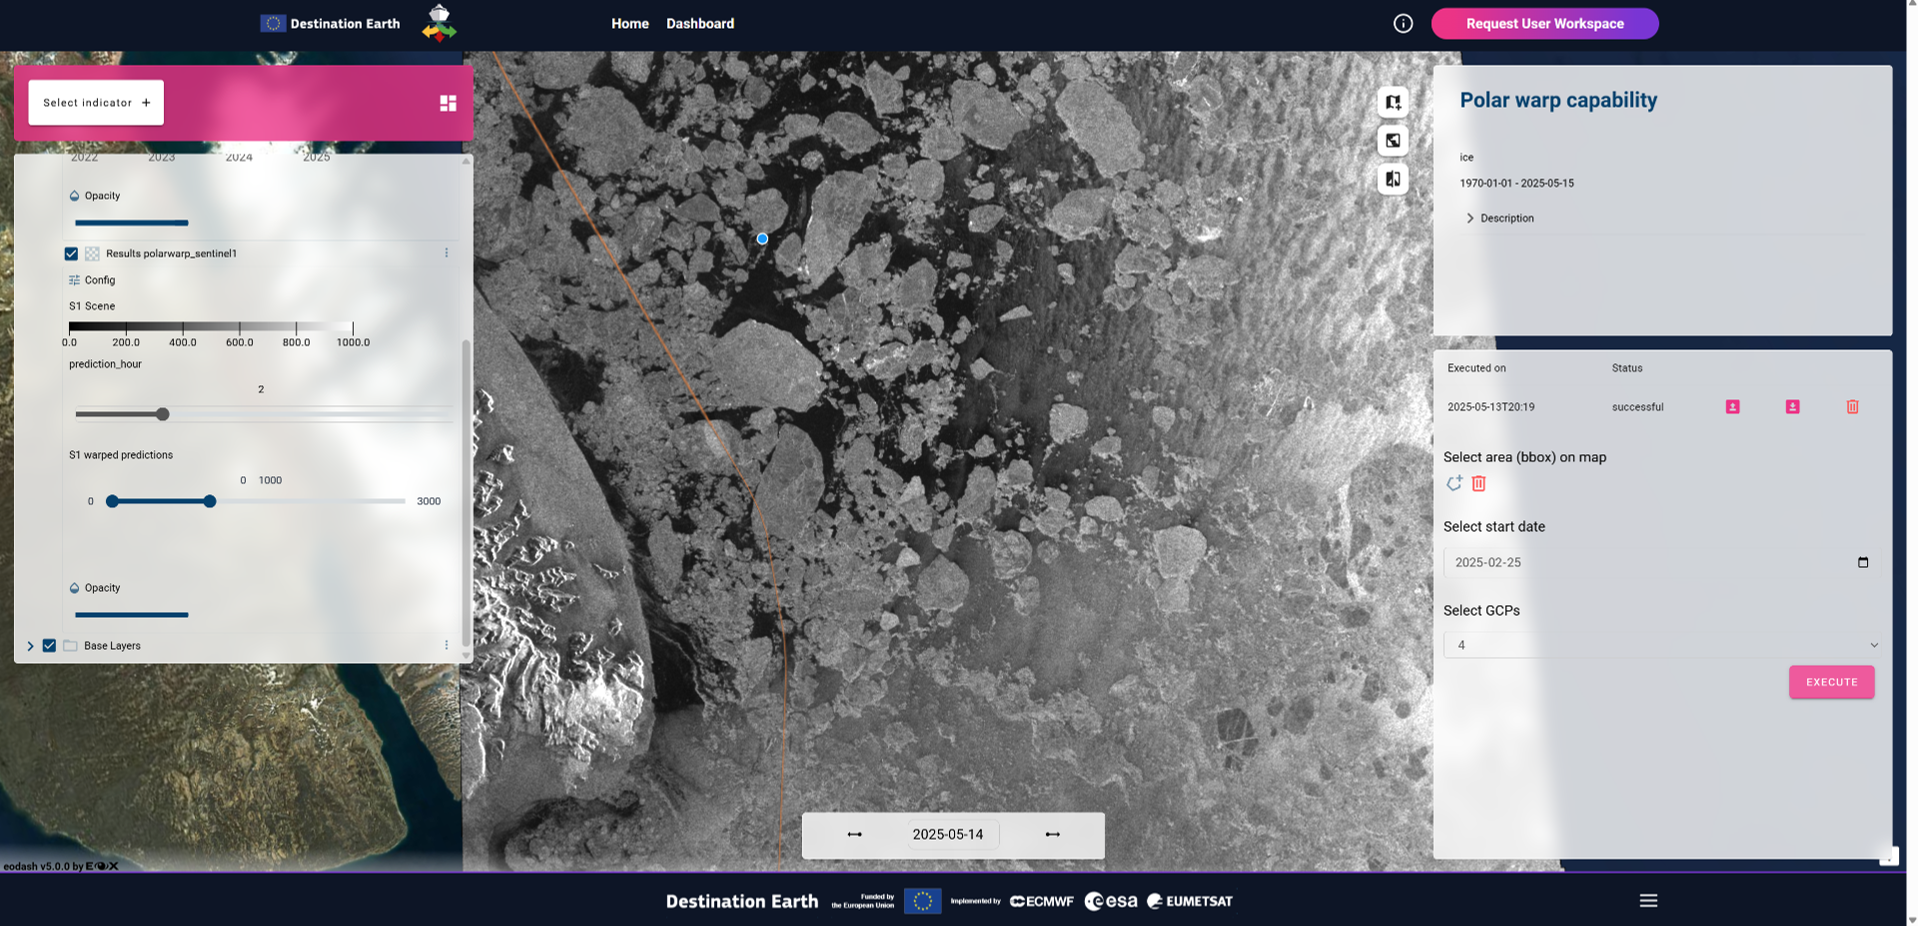
Verification: Demonstration by selecting "Select indicator +" and then and then "Polar Warp Capability" under the "Capabilities" submenu. Select a region of interest. Select a date. Select the number of Ground Control Points (GCP) - a higher number provides better resolution but takes lonnger to run. Click on "Execute". Previous runs are available for retrieval. The window on the top left shows the legend and allows selection of the the layer opacity.
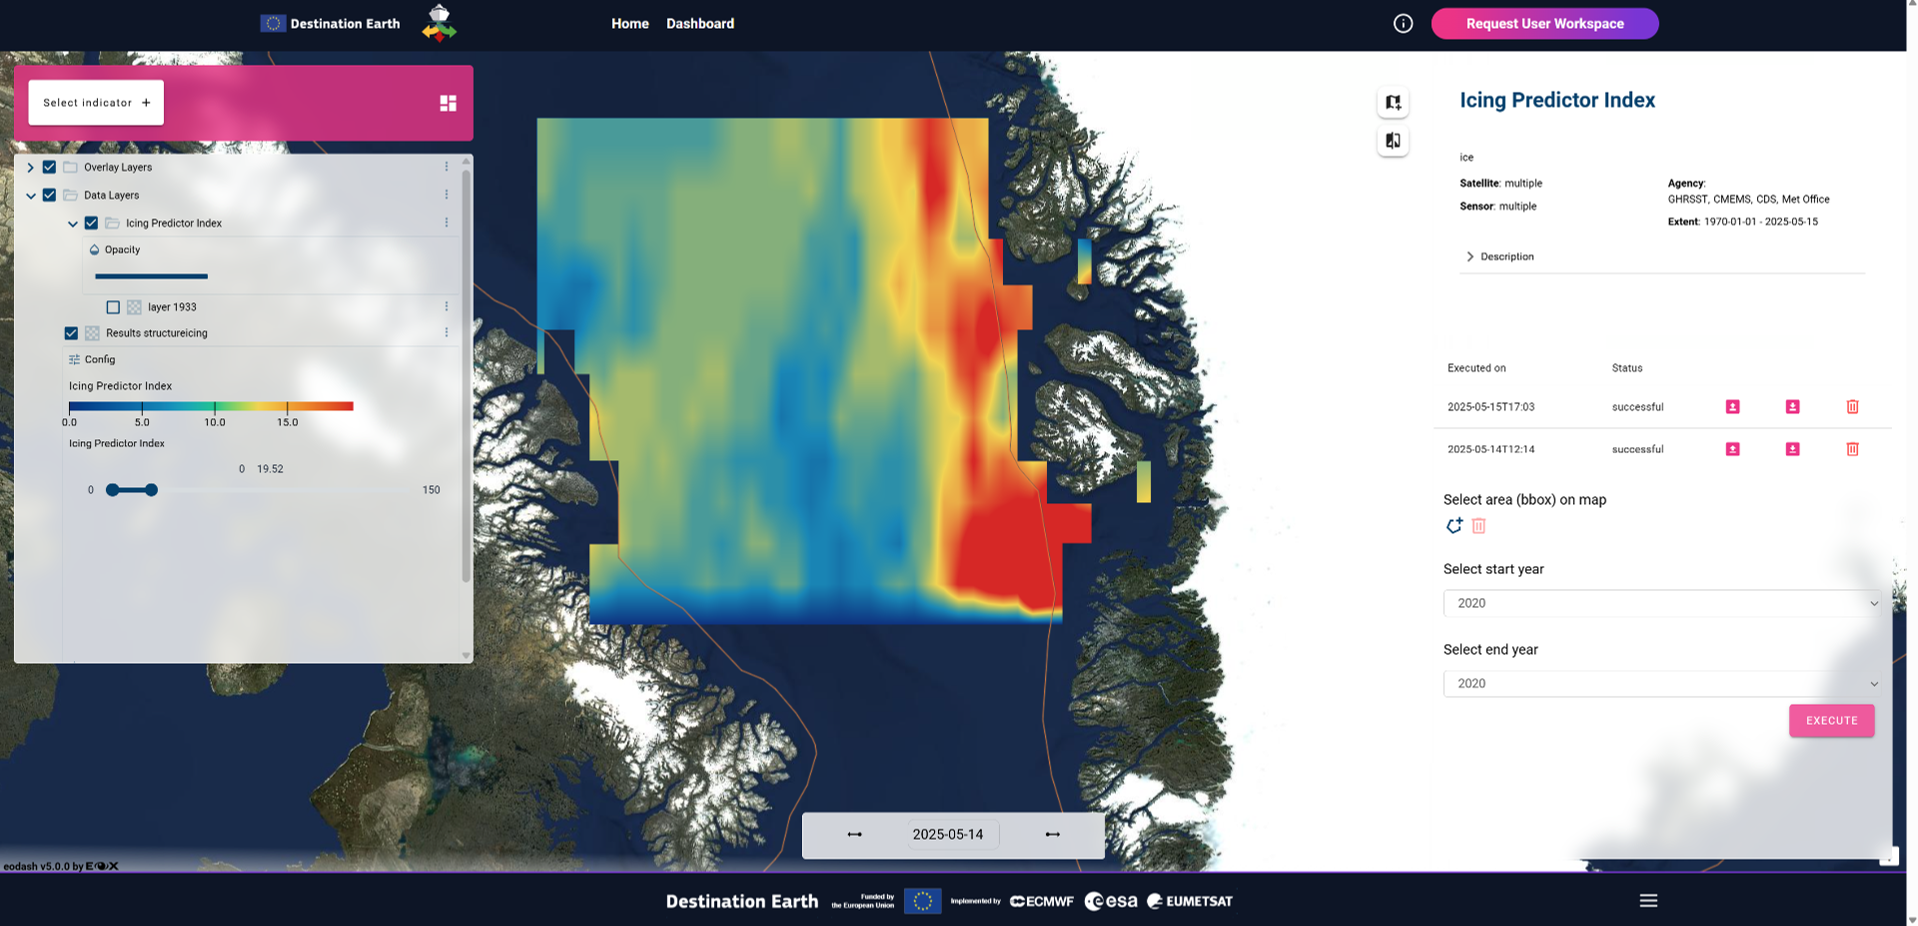
4.11. REQ11 Structure Icing
Requirement: The probability of structure icing is accessible via the DESIDE dashboard for visualisation.
Verification: Demonstration by selecting "Select indicator +" and then and then "Icing Predictor Index" under the "Capabilities" submenu. Select a region of interest. Select a date range in the bottom right window. Click on "Execute". Previous runs are available for retrieval. The window on the top left shows the legend and allows selection of the the layer opacity.
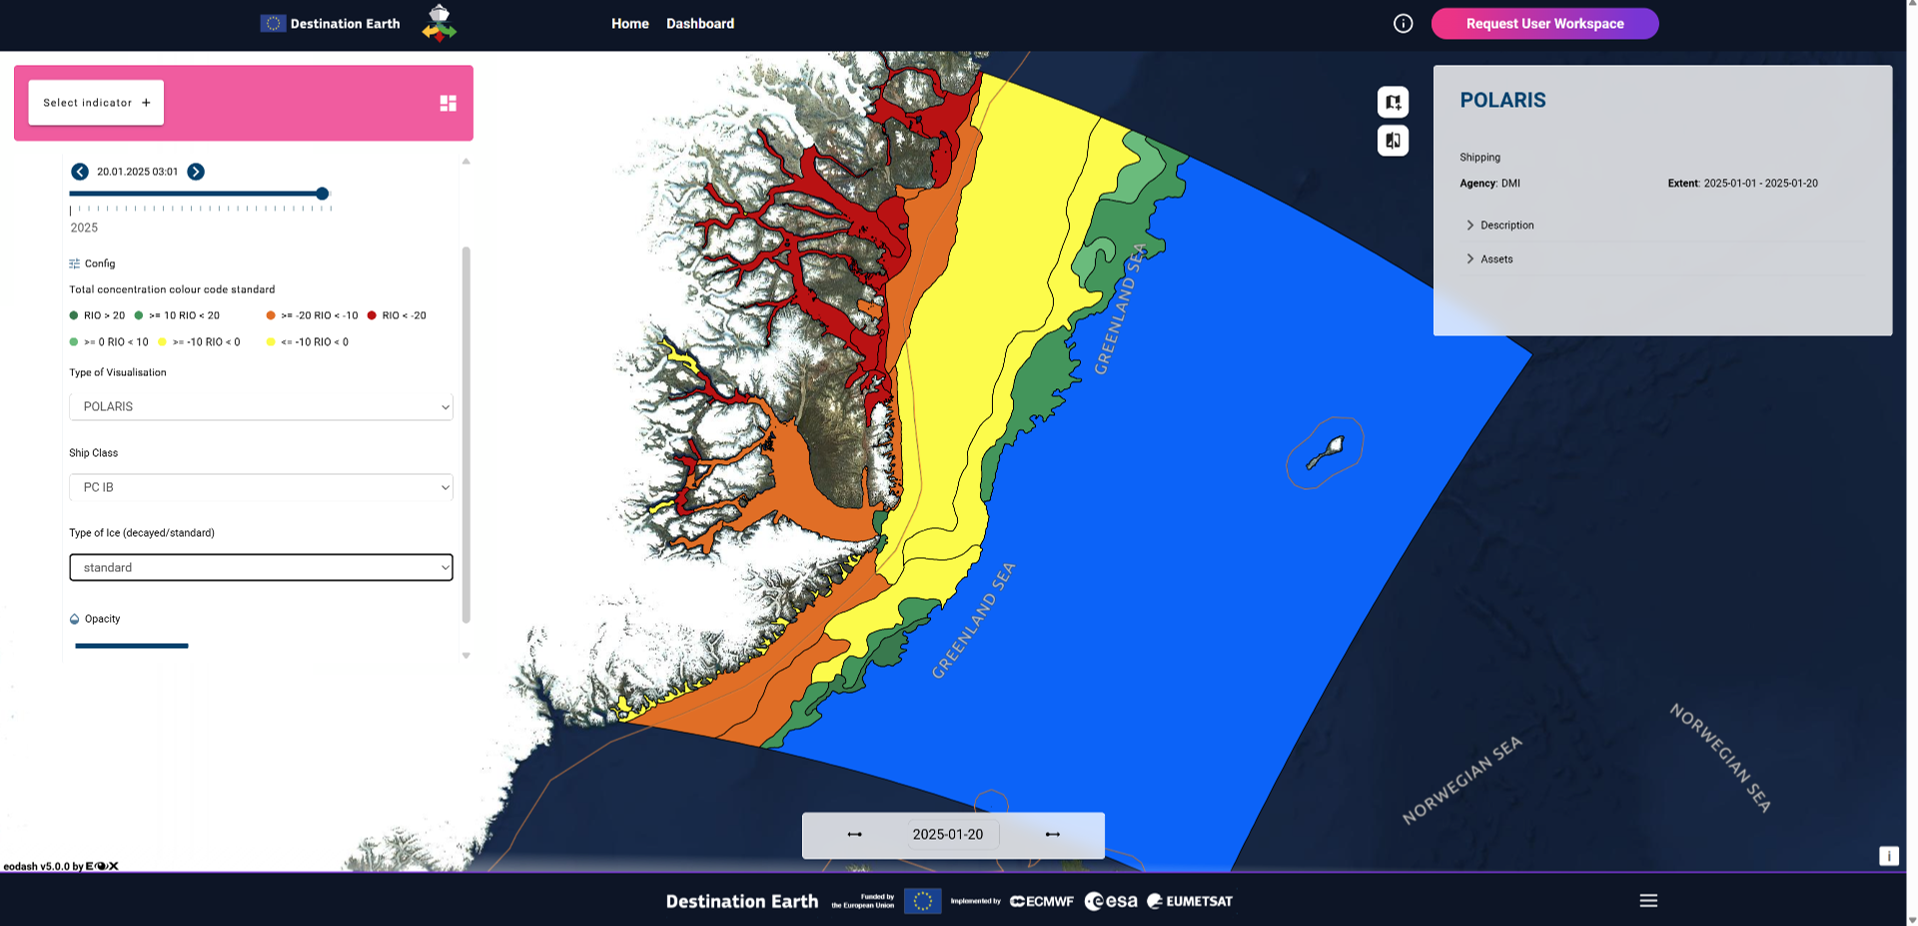
4.12. REQ12 POLARIS Risk
Requirement: The risk to a ship from sea ice is accessible via the DESIDE dashboard for visualisation.
Verification: Demonstration by selecting "Select indicator +" and then and then "POLARIS" under the "Capabilities" submenu. Select a date in the top left window. Select "POLARIS" as the "Type of Visualisation". Select the "Ship Class". Select the Type of Ice (decayed/standard)". More information about the ice is available by hovering over the map polygons.
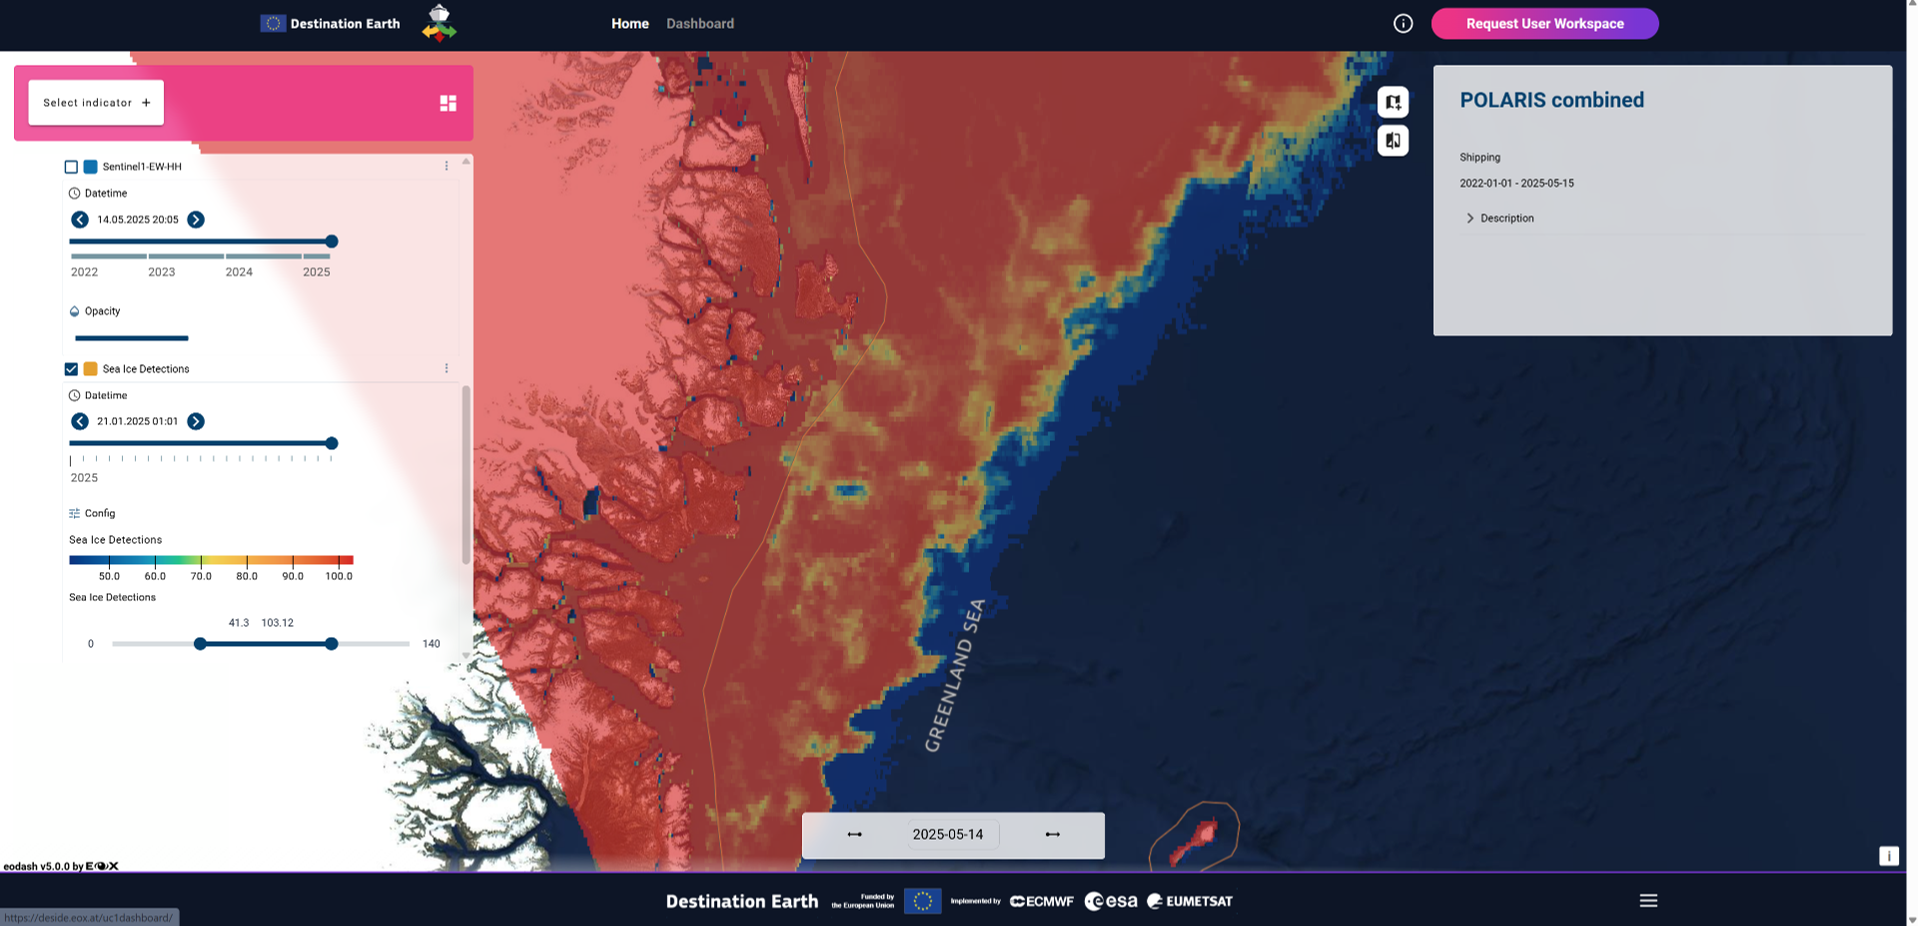
4.13. REQ13 Image Interpretation
Requirement: ML interpretation of sea ice characteristics from Sentinel 1 images is accessible via the DESIDE dashboard for visualisation.
Verification: Demonstration by selecting "Select indicator +" and then and then "POLARIS Combined" under the "Capabilities" submenu. Results are shown as the "Sea Ice Detections" layer. The window on the top left shows the legend and allows selection of the the layer opacity.
4.14. REQ14 RCM Data
Requirement: The available RCM data are accessible via the DESIDE dashboard for visualisation and in a Polar TEP workspace for processing.
Verification: Demonstration in preparation.
In preparation.
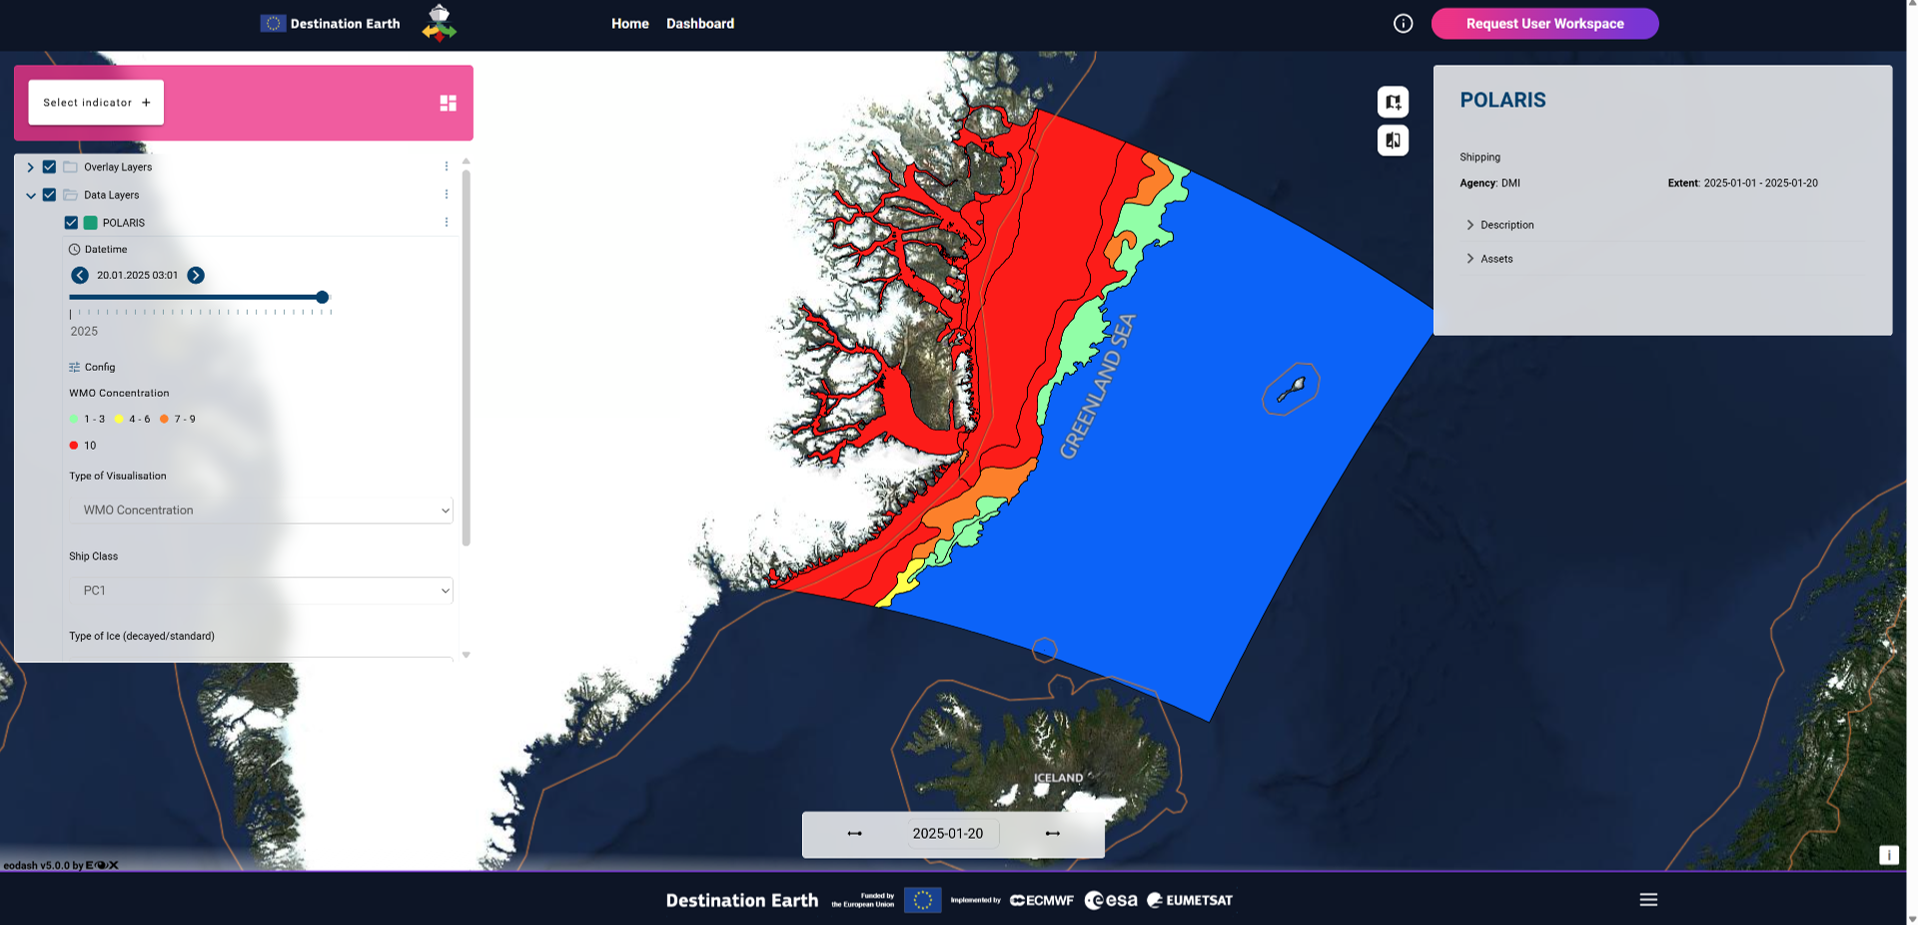
4.15. REQ15 Sea Ice Charts
Requirement: The available sea ice charts are accessible via the DESIDE dashboard for visualisation, in a Polar TEP workspace for processing, and usable by the POLARIS algorithm.
Verification: Demonstration by selecting "Select indicator +" and then and then "POLARIS" under the "Capabilities" submenu. Select a date in the top left window. Select "WMO Concentration" or "WMO Stage of Development" as the "Type of Visualisation". More information about the ice is available by hovering over the map polygons.
<< End of Document >>