HDA Extract Location Values - Tutorial
This notebook demonstrates how to extract time series data for specific locations from the Destination Earth Climate Digital Twin (DT) using HDA.
Monthly Temperature Comparison: 2026 vs 2036 in Rome
Contents
Objective: This notebook has the aim to show how to request Climate DT data selecting locations of Interest via HDA. We take the opportunity to compare monthly average temperature in Rome in 2 different years.
Data Sources: https://
destine .ecmwf .int /climate -change -adaptation -digital -twin -climate -dt/ Methods: The data request is performed using HDA REST API selecting Rome (Italy) as location of Interest. The variable used in this notebook is the Time-mean temperature - avg_t ( https://
codes .ecmwf .int /grib /param -db /235130 ) Prerequisites:
To search and access DEDL data a DestinE user account is needed
To search and access DT data an upgraded access is needed.
Expected Output:
2 covjson files containing the requested data,
1 plot of the monthly mean temperature for Rome in 2026 and 2036
Setup
Let’s import useful packages
pip install --user --quiet --upgrade destinelabNote: you may need to restart the kernel to use updated packages.
import destinelab as deauth
import json
import requests
from requests.adapters import HTTPAdapter
from urllib3.util.retry import Retry
import os
from getpass import getpass
from tqdm import tqdm
import time
from time import sleep
from IPython.display import JSON
import sys
from IPython.display import display, HTML
from datetime import datetime
import pandas as pd
import matplotlib.pyplot as plt
import re
Search for the desired variable and the desired Climate DT collection (a.k.a. Climate DT simulation)
In this example, we search for the Time-mean temperature variable
(https://codes.ecmwf.int/grib/param-db/235130GRIB parameter 235130)
in the Climate DT HDA collection that provides future climate projections from the IFS-FESOM model under the SSP3-7.0 scenario:
EO
The search query includes the desired temporal range, ensuring that only data relevant to the selected period are returned. The resulting response contains the JSON payload that can be used directly to place an order through the HDA API.
To search and access data we need to authenticate using our DESP account
DESP_USERNAME = input("Please input your DESP username: ")
DESP_PASSWORD = getpass("Please input your DESP password: ")

auth = deauth.AuthHandler(DESP_USERNAME, DESP_PASSWORD)
access_token = auth.get_token()
if access_token is not None:
    print("DEDL/DESP Access Token Obtained Successfully")
else:
    print("Failed to Obtain DEDL/DESP Access Token")

auth_headers = {"Authorization": f"Bearer {access_token}"}
Please input your DESP username: eum-dedl-user
Please input your DESP password: ········
DEDL/DESP Access Token Obtained Successfully
Response code: 200
DEDL/DESP Access Token Obtained Successfully
Check if we can access DT
auth.is_DTaccess_allowed(access_token)True2 - Order the Climate DT data
HDA_STAC_ENDPOINT="https://hda.data.destination-earth.eu/stac/v2"
COLLECTION_ID="EO.ECMWF.DAT.D1.DT_CLIMATE.G2.PROJECTIONS_SSP3-7.0_IFS-FESOM.R1"
Rome - 2026
Let’s submit a request to obtain the monthly mean temperature for Rome for the year 2026.
To extract data at a specific geographic location, we use the Polytope Feature Extraction notation. In particular, this example leverages the Time Series Extraction feature, which returns a sequence of values for a selected location across the requested time range.
For more details on Polytope Feature Extraction and the supported extraction features, refer to the official documentation:
https://
response = requests.post(HDA_STAC_ENDPOINT+"/search", headers=auth_headers, json={
 "collections": [COLLECTION_ID],
    "query":  {
    "ecmwf:resolution":{"eq": "standard"},
    "ecmwf:levtype":{"eq": "pl"},
    "ecmwf:year":{"eq": ["2026"]},
    "ecmwf:month":{"eq": ["1","2","3","4","5","6","7","8","9","10","11","12"]},
    "ecmwf:param":{"eq": ["235130"]},
    "ecmwf:levelist":{"eq": ["1000"]},
    "ecmwf:stream":{"eq": "clmn"},
    "ecmwf:feature": {"eq":{ "type" : "timeseries", "points": [[41.9028, 12.4964]], "time_axis": "month" }
}
    }
})

if(response.status_code!= 200):
    (print(response.text))
response.raise_for_status()

product = response.json()["features"][0]
print(json.dumps(product, indent=2))
{
"type": "Feature",
"assets": {},
"id": "DT_CLIMATE_G2_PROJECTIONS_SSP3_7_0_IFS_FESOM_R1_ORDERABLE_58e1eb6af4302cb8e0b3b59003a9a0ba02d16355",
"geometry": {
"type": "Point",
"coordinates": [
12.4964,
41.9028
]
},
"bbox": [
12.4964,
41.9028,
12.4964,
41.9028
],
"collection": "EO.ECMWF.DAT.D1.DT_CLIMATE.G2.PROJECTIONS_SSP3-7.0_IFS-FESOM.R1",
"stac_version": "1.1.0",
"properties": {
"datetime": "2026-01-01T00:00:00.000Z",
"end_datetime": "2026-09-30T23:59:59.000Z",
"start_datetime": "2026-01-01T00:00:00.000Z",
"title": "DT_CLIMATE_G2_PROJECTIONS_SSP3_7_0_IFS_FESOM_R1_ORDERABLE_58e1eb6af4302cb8e0b3b59003a9a0ba02d16355",
"ecmwf:activity": "projections",
"ecmwf:class": "d1",
"ecmwf:dataset": "climate-dt",
"ecmwf:experiment": "SSP3-7.0",
"ecmwf:expver": "0001",
"ecmwf:generation": "2",
"ecmwf:levelist": [
"1000"
],
"ecmwf:levtype": "pl",
"ecmwf:model": "IFS-FESOM",
"ecmwf:month": [
"1",
"10",
"11",
"12",
"2",
"3",
"4",
"5",
"6",
"7",
"8",
"9"
],
"ecmwf:param": [
"235130"
],
"ecmwf:realization": "1",
"ecmwf:resolution": "standard",
"ecmwf:stream": "clmn",
"ecmwf:type": "fc",
"ecmwf:year": [
"2026"
],
"order:status": "orderable",
"product:type": "climate-dt",
"federation:backends": [
"dedt_lumi"
],
"providers": [
{
"name": "dedt_lumi",
"roles": [
"host"
]
}
]
},
"stac_extensions": [
"https://stac-extensions.github.io/order/v1.1.0/schema.json",
"https://stac-extensions.github.io/product/v1.0.0/schema.json"
],
"links": [
{
"rel": "retrieve",
"type": "application/geo+json",
"href": "https://hda.data.destination-earth.eu/stac/v2/collections/EO.ECMWF.DAT.D1.DT_CLIMATE.G2.PROJECTIONS_SSP3-7.0_IFS-FESOM.R1/order",
"method": "POST",
"title": "Retrieve",
"body": {
"activity": "projections",
"class": "d1",
"dataset": "climate-dt",
"experiment": "SSP3-7.0",
"expver": "0001",
"feature": {
"points": [
[
41.9028,
12.4964
]
],
"time_axis": "month",
"type": "timeseries"
},
"generation": "2",
"levelist": [
"1000"
],
"levtype": "pl",
"model": "IFS-FESOM",
"month": [
"1",
"10",
"11",
"12",
"2",
"3",
"4",
"5",
"6",
"7",
"8",
"9"
],
"param": [
"235130"
],
"realization": "1",
"resolution": "standard",
"stream": "clmn",
"type": "fc",
"year": [
"2026"
]
}
},
{
"rel": "collection",
"type": "application/json",
"href": "https://hda.data.destination-earth.eu/stac/v2/collections/EO.ECMWF.DAT.D1.DT_CLIMATE.G2.PROJECTIONS_SSP3-7.0_IFS-FESOM.R1",
"title": "Climate Change Adaptation Digital Twin (Climate Adaptation DT) - Future Projection - IFS-FESOM - Generation-2 - Realization-1"
},
{
"rel": "self",
"type": "application/geo+json",
"href": "https://hda.data.destination-earth.eu/stac/v2/collections/EO.ECMWF.DAT.D1.DT_CLIMATE.G2.PROJECTIONS_SSP3-7.0_IFS-FESOM.R1/items/DT_CLIMATE_G2_PROJECTIONS_SSP3_7_0_IFS_FESOM_R1_ORDERABLE_58e1eb6af4302cb8e0b3b59003a9a0ba02d16355",
"title": "Original item link"
}
]
}
link = next((l for l in product.get('links', []) if l.get("rel") == "retrieve"), None)

if link:
    href = link.get("href")
    body = link.get("body")   # optional: depends on extension
    print("order endpoint:", href)
    print("order body:")
    print(json.dumps(body, indent=4))
else:
    print(f"No link with rel='{target_rel}' found")
order endpoint: https://hda.data.destination-earth.eu/stac/v2/collections/EO.ECMWF.DAT.D1.DT_CLIMATE.G2.PROJECTIONS_SSP3-7.0_IFS-FESOM.R1/order
order body:
{
    "activity": "projections",
    "class": "d1",
    "dataset": "climate-dt",
    "experiment": "SSP3-7.0",
    "expver": "0001",
    "feature": {
        "points": [
            [
                41.9028,
                12.4964
            ]
        ],
        "time_axis": "month",
        "type": "timeseries"
    },
    "generation": "2",
    "levelist": [
        "1000"
    ],
    "levtype": "pl",
    "model": "IFS-FESOM",
    "month": [
        "1",
        "10",
        "11",
        "12",
        "2",
        "3",
        "4",
        "5",
        "6",
        "7",
        "8",
        "9"
    ],
    "param": [
        "235130"
    ],
    "realization": "1",
    "resolution": "standard",
    "stream": "clmn",
    "type": "fc",
    "year": [
        "2026"
    ]
}
response = requests.post(href, json=body, headers=auth_headers)

if response.status_code != 200:
    print(response.content)
response.raise_for_status()

ordered_item = response.json()

product_id = ordered_item["id"]
order_status = ordered_item["properties"].get("order:status", "unknown")
federation_backend = ordered_item["properties"].get("federation:backends", [None])[0]

print(f"Product ordered: {product_id}")
print(f"Provider: {federation_backend}")
print(f"Order status: {order_status}")
Product ordered: 01ejwrk982yfgt20053x5ywk98
Provider: dedt_lumi
Order status: succeeded
#Sometimes requests to polytope get timeouts, it is then convenient define a retry strategy
retry_strategy = Retry(
    total=10,  # Total number of retries
    status_forcelist=[500, 502, 503, 504],  # List of 5xx status codes to retry on
    allowed_methods=["GET",'POST'],  # Methods to retry
    backoff_factor=1  # Wait time between retries (exponential backoff)
)

# Create an adapter with the retry strategy
adapter = HTTPAdapter(max_retries=retry_strategy)

# Create a session and mount the adapter
session = requests.Session()
session.mount("https://", adapter)


response = session.post(href, json=body, headers=auth_headers)


if response.status_code != 200:
    print(response.content)
response.raise_for_status()

ordered_item = response.json()

product_id = ordered_item["id"]
storage_tier = ordered_item["properties"].get("storage:tier", "online")
order_status = ordered_item["properties"].get("order:status", "unknown")
federation_backend = ordered_item["properties"].get("federation:backends", [None])[0]

print(f"Order status: {order_status}")


#timeout and step for polling (sec)
TIMEOUT = 300
STEP = 1
ORDER_STATUS = "succeeded"

self_url = f"{HDA_STAC_ENDPOINT}/collections/{COLLECTION_ID}/items/{product_id}"
item = {}

for i in range(0, TIMEOUT, STEP):
    print(f"Polling {i + 1}/{TIMEOUT // STEP}")

    response = session.get(self_url, headers=auth_headers)
    if response.status_code != 200:
        print(response.content)
    response.raise_for_status()
    item = response.json()
    print(item["properties"].get("order:status"))
    status = item["properties"].get("order:status")

    if status == ORDER_STATUS:
        download_url = item["assets"]["downloadLink"]["href"]
        print("Product is ready to be downloaded.")
        print(f"Download URL: {download_url}")
        break

    time.sleep(STEP)
else:
    order_status = item["properties"].get("order:status", "unknown")
    print(f"We could not download the product after {TIMEOUT // STEP} tries. Current order status is {order_status}")
Order status: succeeded
Polling 1/300
succeeded
Product is ready to be downloaded.
Download URL: https://hda-download.lumi.data.destination-earth.eu/data/dedt_lumi/EO.ECMWF.DAT.D1.DT_CLIMATE.G2.PROJECTIONS_SSP3-7.0_IFS-FESOM.R1/01ejwrk982yfgt8005f3hetp6v/downloadLink
response = session.get(download_url, stream=True, headers=auth_headers)
response.raise_for_status()

content_disposition = response.headers.get('Content-Disposition')
total_size = int(response.headers.get("content-length", 0))
if content_disposition:
    ext = re.search(r'\.(\w+)', content_disposition).group(0) if re.search(r'\.(\w+)', content_disposition) else '.covjson'
    filename = '2t_rome_2026'+ext
else:
    filename = os.path.basename(product_id)

# Open a local file in binary write mode and write the content
print(f"downloading {filename}")

with tqdm(total=total_size, unit="B", unit_scale=True) as progress_bar:
    with open(filename, 'wb') as f:
        for data in response.iter_content(1024):
            progress_bar.update(len(data))
            f.write(data)
downloading 2t_rome_2026.covjson
1.55kB [00:00, 3.37MB/s]
Rome - 2036
response = requests.post(HDA_STAC_ENDPOINT+"/search", headers=auth_headers, json={
 "collections": [COLLECTION_ID],
    "query":  {
    "ecmwf:resolution":{"eq": "standard"},
    "ecmwf:levtype":{"eq": "pl"},
    "ecmwf:year":{"eq": ["2036"]},
    "ecmwf:month":{"eq": ["1","2","3","4","5","6","7","8","9","10","11","12"]},
    "ecmwf:param":{"eq": ["235130"]},
    "ecmwf:levelist":{"eq": ["1000"]},
    "ecmwf:stream":{"eq": "clmn"},
    "ecmwf:feature": {"eq":{ "type" : "timeseries", "points": [[41.9028, 12.4964]], "time_axis": "month" }
}
    }
})
if(response.status_code!= 200):
(print(response.text))
response.raise_for_status()
product = response.json()["features"][0]
JSON(product)
link = next((l for l in product.get('links', []) if l.get("rel") == "retrieve"), None)

if link:
    href = link.get("href")
    body = link.get("body")   # optional: depends on extension
    print("order endpoint:", href)
    print("order body:")
    print(json.dumps(body, indent=4))
else:
    print(f"No link with rel='{target_rel}' found")
order endpoint: https://hda.data.destination-earth.eu/stac/v2/collections/EO.ECMWF.DAT.D1.DT_CLIMATE.G2.PROJECTIONS_SSP3-7.0_IFS-FESOM.R1/order
order body:
{
    "activity": "projections",
    "class": "d1",
    "dataset": "climate-dt",
    "experiment": "SSP3-7.0",
    "expver": "0001",
    "feature": {
        "points": [
            [
                41.9028,
                12.4964
            ]
        ],
        "time_axis": "month",
        "type": "timeseries"
    },
    "generation": "2",
    "levelist": [
        "1000"
    ],
    "levtype": "pl",
    "model": "IFS-FESOM",
    "month": [
        "1",
        "10",
        "11",
        "12",
        "2",
        "3",
        "4",
        "5",
        "6",
        "7",
        "8",
        "9"
    ],
    "param": [
        "235130"
    ],
    "realization": "1",
    "resolution": "standard",
    "stream": "clmn",
    "type": "fc",
    "year": [
        "2036"
    ]
}
response = session.post(href, json=body, headers=auth_headers)

if response.status_code != 200:
    print(response.content)
response.raise_for_status()

ordered_item = response.json()

product_id = ordered_item["id"]
order_status = ordered_item["properties"].get("order:status", "unknown")
federation_backend = ordered_item["properties"].get("federation:backends", [None])[0]

print(f"Product ordered: {product_id}")
print(f"Provider: {federation_backend}")
print(f"Order status: {order_status}")
Product ordered: 01ejwrk982yfgtg005x45c8mvv
Provider: dedt_lumi
Order status: succeeded
response = session.post(href, json=body, headers=auth_headers)


if response.status_code != 200:
    print(response.content)
response.raise_for_status()

ordered_item = response.json()

product_id = ordered_item["id"]
storage_tier = ordered_item["properties"].get("storage:tier", "online")
order_status = ordered_item["properties"].get("order:status", "unknown")
federation_backend = ordered_item["properties"].get("federation:backends", [None])[0]

print(f"Order status: {order_status}")


#timeout and step for polling (sec)
TIMEOUT = 300
STEP = 1
ORDER_STATUS = "succeeded"

self_url = f"{HDA_STAC_ENDPOINT}/collections/{COLLECTION_ID}/items/{product_id}"
item = {}

for i in range(0, TIMEOUT, STEP):
    print(f"Polling {i + 1}/{TIMEOUT // STEP}")

    response = session.get(self_url, headers=auth_headers)
    if response.status_code != 200:
        print(response.content)
    response.raise_for_status()
    item = response.json()
    print(item["properties"].get("order:status"))
    status = item["properties"].get("order:status")

    if status == ORDER_STATUS:
        download_url = item["assets"]["downloadLink"]["href"]
        print("Product is ready to be downloaded.")
        print(f"Download URL: {download_url}")
        break

    time.sleep(STEP)
else:
    order_status = item["properties"].get("order:status", "unknown")
    print(f"We could not download the product after {TIMEOUT // STEP} tries. Current order status is {order_status}")
Order status: succeeded
Polling 1/300
succeeded
Product is ready to be downloaded.
Download URL: https://hda-download.lumi.data.destination-earth.eu/data/dedt_lumi/EO.ECMWF.DAT.D1.DT_CLIMATE.G2.PROJECTIONS_SSP3-7.0_IFS-FESOM.R1/01ejwrk982yfgtj005kq7cqk9h/downloadLink
response =session.get(download_url, stream=True, headers=auth_headers)
response.raise_for_status()

content_disposition = response.headers.get('Content-Disposition')
total_size = int(response.headers.get("content-length", 0))
if content_disposition:
    ext = re.search(r'\.(\w+)', content_disposition).group(0) if re.search(r'\.(\w+)', content_disposition) else '.covjson'
    filename = '2t_rome_2036'+ext
else:
    filename = os.path.basename(product_id)

# Open a local file in binary write mode and write the content
print(f"downloading {filename}")

with tqdm(total=total_size, unit="B", unit_scale=True) as progress_bar:
    with open(filename, 'wb') as f:
        for data in response.iter_content(1024):
            progress_bar.update(len(data))
            f.write(data)
downloading 2t_rome_2036.covjson
1.55kB [00:00, 3.68MB/s]
def load_covjson(filepath, city):

    with open(filepath, "r") as f:
        data = json.load(f)

    cov = data["coverages"][0]

    times = cov["domain"]["axes"]["t"]["values"]
    values = cov["ranges"]["avg_t"]["values"]

    df = pd.DataFrame({
        "time": pd.to_datetime(times),
        "value_K": values
    })
    df["value_C"] = df["value_K"] - 273.15

    df["year"] = df["time"].dt.year
    df["month"] = df["time"].dt.month

    df["city"] = city

    return df
rome_2026 = load_covjson("2t_rome_2026.covjson", "Rome_2026")
rome_2036 = load_covjson("2t_rome_2036.covjson", "Rome_2036")
df = pd.concat([rome_2026,rome_2036])
Two years comparison - 2026 - 2036
Differences between years to check if one year is systematically warmer, if both years follow the same seasonal pattern or if there are shifts (e.g. earlier warming)
import matplotlib.pyplot as plt

monthly = df.groupby(["city", "month"])["value_C"].mean().reset_index() #seasonal cycle

for city in ["Rome_2026", "Rome_2036"]:
    subset = monthly[monthly["city"] == city]
    plt.plot(subset["month"], subset["value_C"], marker="o", label=city)

plt.title("Projected Changes in Monthly Mean Temperature — Rome (2026 vs 2036)")
plt.xlabel("Month")
plt.ylabel("Temperature (°C)")
plt.legend()
plt.grid()
plt.show()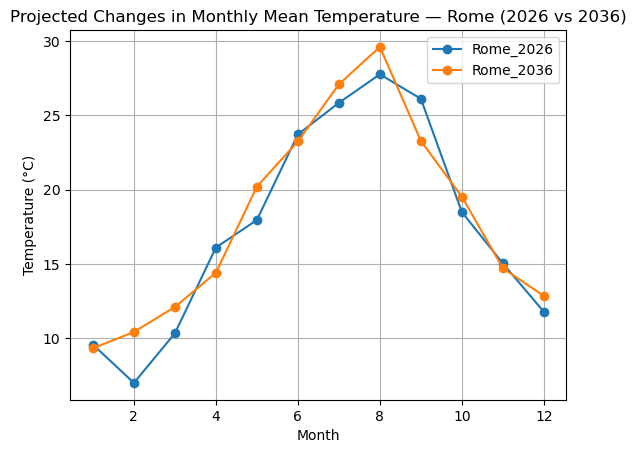
Summary
In this notebook, we demonstrated how to access Climate DT data through the HDA REST API by selecting a specific location of interest using Polytope Feature Extraction.
We searched the Climate DT future projections collection, requested the Time-mean temperature (avg_t) variable for Rome, and retrieved monthly mean temperature time series for two different years. The resulting CovJSON files were then used to compare monthly temperature patterns between 2026 and 2036.
Resources and references
Destination Earth Climate Adaptation Digital Twin (Climate DT)
ECMWF GRIB Parameter Database: Time-mean Temperature (avg_t, Parameter 235130)
IFS-FESOM Climate DT Future Projections (SSP3-7.0) - HDA collection
DestinE Data Lake (DEDL) Harmonized Data Access (HDA) documentation
Credit:
HDA Polytope used in this context are both packages provided by the European Centre for Medium-Range Weather Forecasts (ECMWF).