How to use EODAG to search and access DEDL data
EODAG is a command line tool and a Python package for searching and downloading earth observation data via a unified API regardless of the data provider. Detailed information about the usage of EODAG can be found on the project documentation page.This notebook demonstrates how to use the DEDL provider in EODAG, using Python code.
Setup: EODAG configuration to use the provider DEDL .
Search: search DEDL data, we search for Sentinel-3 data.
Filter: filter DEDL data.
Download: download DEDL data.
The complete guide on how to use EODAG Python API is available via https://
Please note that the two factor authentication (2FA) is still not implemented in EODAG. The users who have enabled 2FA on DESP will not be able to run this notebook.
Setup
In this section, we set:
The output_dir, the directory where to store downloaded products.
The DEDL credentials, you’ll be asked to enter your DEDL credentials.
The search timeout, it is of 60 seconds to avoid any unexpected errors because of long running search queries.
import os
from getpass import getpass
workspace = 'eodag_workspace'
if not os.path.isdir(workspace):
os.mkdir(workspace)
os.environ["EODAG__DEDL__DOWNLOAD__OUTPUT_DIR"] = os.path.abspath(workspace)
#os.environ["EODAG__DEDL__DOWNLOAD__OUTPUTS_PREFIX"] = os.path.abspath(workspace)
os.environ["EODAG__DEDL__PRIORITY"]="10"
os.environ["EODAG__DEDL__SEARCH__TIMEOUT"]="60"
DESP_USERNAME = input("Please input your DESP username or email: ")
DESP_PASSWORD = getpass("Please input your DESP password: ")
os.environ["EODAG__DEDL__AUTH__CREDENTIALS__USERNAME"]=DESP_USERNAME
os.environ["EODAG__DEDL__AUTH__CREDENTIALS__PASSWORD"]=DESP_PASSWORD
Please input your DESP username or email: eum-dedl-user
Please input your DESP password: ········
Import EODAG and list available products on DEDL
We now need to import the EODataAccessGateway class. The class is going to take care of all the following operations.
We can start listing the products available using dedl as provider.
from eodag import EODataAccessGateway
dag = EODataAccessGateway()
[product_type["ID"] + ", " + product_type["title"] for product_type in dag.list_product_types("dedl")]
['AERIS_IAGOS, In-service Aircraft for a Global Observing System',
'CAMS_EAC4, CAMS global reanalysis (EAC4)',
'CAMS_EAC4_MONTHLY, CAMS global reanalysis (EAC4) monthly averaged fields',
'CAMS_EU_AIR_QUALITY_FORECAST, CAMS European air quality forecasts',
'CAMS_EU_AIR_QUALITY_RE, CAMS European air quality reanalyses',
'CAMS_GAC_FORECAST, CAMS global atmospheric composition forecasts',
'CAMS_GFE_GFAS, CAMS global biomass burning emissions based on fire radiative power (GFAS)',
'CAMS_GLOBAL_EMISSIONS, CAMS global emission inventories',
'CAMS_GREENHOUSE_EGG4, CAMS global greenhouse gas reanalysis (EGG4)',
'CAMS_GREENHOUSE_EGG4_MONTHLY, CAMS global greenhouse gas reanalysis (EGG4) monthly averaged fields',
'CAMS_GREENHOUSE_INVERSION, CAMS global inversion-optimised greenhouse gas fluxes and concentrations',
'CAMS_GRF, CAMS global radiative forcings',
'CAMS_GRF_AUX, CAMS global radiative forcing - auxilliary variables',
'CAMS_SOLAR_RADIATION, CAMS solar radiation time-series',
'CLMS_CORINE, CORINE Land Cover',
'CLMS_GLO_DMP_333M, 10-daily Dry Matter Productivity 333M',
'CLMS_GLO_FAPAR_333M, Global 10-daily Fraction of Absorbed PAR 333m',
'CLMS_GLO_FCOVER_333M, Global 10-daily Fraction of Vegetation Cover 333m',
'CLMS_GLO_GDMP_333M, 10-daily Gross Dry Matter Productivity 333M',
'CLMS_GLO_LAI_333M, Global 10-daily Leaf Area Index 333m',
'CLMS_GLO_NDVI_1KM_LTS, Normalized Difference Vegetation Index: global Long Term Statistics (raster 1km) - version 2, Apr 2019',
'CLMS_GLO_NDVI_333M, Global 10-daily Normalized Difference Vegetation Index 333M',
'COP_DEM_GLO30_DGED, Copernicus DEM GLO-30 DGED',
'COP_DEM_GLO30_DTED, Copernicus DEM GLO-30 DTED',
'COP_DEM_GLO90_DGED, Copernicus DEM GLO-90 DGED',
'COP_DEM_GLO90_DTED, Copernicus DEM GLO-90 DTED',
'DT_CLIMATE_ADAPTATION, Climate Change Adaptation Digital Twin (DT)',
'DT_EXTREMES, Weather and Geophysical Extremes Digital Twin (DT)',
'EEA_DAILY_VI, Vegetation Indices, daily, UTM projection',
'EFAS_FORECAST, River discharge and related forecasted data by the European Flood Awareness System',
'EFAS_HISTORICAL, River discharge and related historical data from the European Flood Awareness System',
'EFAS_REFORECAST, Reforecasts of river discharge and related data by the European Flood Awareness System',
'EFAS_SEASONAL, Seasonal forecasts of river discharge and related data by the European Flood Awareness System',
'EFAS_SEASONAL_REFORECAST, Seasonal reforecasts of river discharge and related data by the European Flood Awareness System',
'ERA5_LAND, ERA5-Land hourly data from 1950 to present',
'ERA5_LAND_MONTHLY, ERA5-Land monthly averaged data from 1950 to present',
'ERA5_PL, ERA5 hourly data on pressure levels from 1940 to present',
'ERA5_PL_MONTHLY, ERA5 monthly averaged data on pressure levels from 1940 to present',
'ERA5_SL, ERA5 hourly data on single levels from 1940 to present',
'ERA5_SL_MONTHLY, ERA5 monthly averaged data on single levels from 1940 to present',
'EUSTAT_GREENHOUSE_GAS_EMISSION_AGRICULTURE, Eurostat - Greenhouse gas emissions from agriculture',
'EUSTAT_POP_AGE_GROUP_SEX_NUTS3, Population on 1 January by age, sex and NUTS 3 region',
'EUSTAT_POP_AGE_SEX_NUTS2, Population on 1 January by age, sex and NUTS 2 region',
'EUSTAT_POP_CHANGE_DEMO_BALANCE_CRUDE_RATES_NUTS3, Population change - Demographic balance and crude rates at regional level (NUTS 3)',
'EUSTAT_SHARE_ENERGY_FROM_RENEWABLE, Share of energy from renewable sources',
'FIRE_HISTORICAL, Fire danger indices historical data from the Copernicus Emergency Management Service',
'GLACIERS_DIST_RANDOLPH, Glaciers distribution data from the Randolph Glacier Inventory for year 2000',
'GLOFAS_FORECAST, River discharge and related forecasted data by the Global Flood Awareness System',
'GLOFAS_HISTORICAL, River discharge and related historical data from the Global Flood Awareness System',
'GLOFAS_REFORECAST, Reforecasts of river discharge and related data by the Global Flood Awareness System',
'GLOFAS_SEASONAL, Seasonal forecasts of river discharge and related data by the Global Flood Awareness System',
'GLOFAS_SEASONAL_REFORECAST, Seasonal reforecasts of river discharge and related data from the Global Flood Awareness System',
'GRIDDED_GLACIERS_MASS_CHANGE, Glacier mass change gridded data from 1976 to present derived from the Fluctuations of Glaciers Database',
'GSW_CHANGE, Global Surface Water Occurrence Change Intensity 1984-2020',
'GSW_EXTENT, Global Surface Water Maximum Water Extent 1984-2021',
'GSW_OCCURRENCE, Global Surface Water Occurrence 1984-2021',
'GSW_RECURRENCE, Global Surface Water Recurrence 1984-2021',
'GSW_SEASONALITY, Global Surface Water Seasonality 2014-2020',
'GSW_TRANSITIONS, Global Surface Water Transitions 1984-2021',
'ISIMIP_CLIMATE_FORCING_ISIMIP3B, ISIMIP3b climate input data',
'ISIMIP_SOCIO_ECONOMIC_FORCING_ISIMIP3B, ISIMIP3b socio-economic input data',
'LANDSAT_C2L1, Landsat Collection 2 Level-1 Product',
'LANDSAT_C2L2, Landsat OLI and TIRS Collection 2 Level-2 Science Products 30-meter multispectral data.',
'METOP_AMSU_L1, AMSU-A Level 1B - Metop - Global',
'METOP_ASCSZF1B, ASCAT Level 1 Sigma0 Full Resolution - Metop - Global',
'METOP_ASCSZFR02, ASCAT Level 1 SZF Climate Data Record Release 2 - Metop',
'METOP_ASCSZO1B, ASCAT Level 1 Sigma0 resampled at 25 km Swath Grid - Metop - Global',
'METOP_ASCSZOR02, ASCAT Level 1 SZO Climate Data Record Release 2 - Metop',
'METOP_ASCSZR1B, ASCAT Level 1 Sigma0 resampled at 12.5 km Swath Grid - Metop - Global',
'METOP_ASCSZRR02, ASCAT Level 1 SZR Climate Data Record Release 2 - Metop',
'METOP_AVHRRGACR02, AVHRR GAC Atmospheric Motion Vectors Climate Data Record Release 2 - Multimission - Polar',
'METOP_AVHRRL1, AVHRR Level 1B - Metop - Global',
'METOP_GLB_SST_NC, Global L3C AVHRR Sea Surface Temperature (GHRSST) - Metop',
'METOP_GOMEL1, GOME-2 Level 1B - Metop - Global',
'METOP_GOMEL1R03, GOME-2 Level 1B Fundamental Data Record Release 3 - Metop-A and -B',
'METOP_HIRSL1, HIRS Level 1B - Metop - Global',
'METOP_IASIL1C_ALL, IASI Level 1C - All Spectral Samples - Metop - Global',
'METOP_IASSND02, IASI Combined Sounding Products - Metop',
'METOP_IASTHR011, IASI All Sky Temperature and Humidity Profiles - Climate Data Record Release 1.1 - Metop-A and -B',
'METOP_LSA_002, Daily Land Surface Temperature - Metop',
'METOP_MHSL1, MHS Level 1B - Metop - Global',
'METOP_OSI_104, ASCAT Coastal Winds at 12.5 km Swath Grid - Metop',
'METOP_OSI_150A, ASCAT L2 25 km Winds Data Record Release 1 - Metop',
'METOP_OSI_150B, ASCAT L2 12.5 km Winds Data Record Release 1 - Metop',
'METOP_SOMO12, ASCAT Soil Moisture at 12.5 km Swath Grid in NRT - Metop',
'METOP_SOMO25, ASCAT Soil Moisture at 25 km Swath Grid in NRT - Metop',
'MO_GLOBAL_ANALYSISFORECAST_BGC_001_028, Global Ocean Biogeochemistry Analysis and Forecast',
'MO_GLOBAL_ANALYSISFORECAST_PHY_001_024, Global Ocean Physics Analysis and Forecast',
'MO_GLOBAL_ANALYSISFORECAST_WAV_001_027, Global Ocean Waves Analysis and Forecast',
'MO_GLOBAL_MULTIYEAR_BGC_001_033, Global ocean low and mid trophic levels biomass content hindcast',
'MO_GLOBAL_MULTIYEAR_PHY_ENS_001_031, Global Ocean Ensemble Physics Reanalysis',
'MO_GLOBAL_MULTIYEAR_WAV_001_032, Global Ocean Waves Reanalysis',
'MO_INSITU_GLO_PHY_TS_OA_MY_013_052, Global Ocean- Delayed Mode gridded CORA- In-situ Observations objective analysis in Delayed Mode',
'MO_INSITU_GLO_PHY_TS_OA_NRT_013_002, Global Ocean- Real time in-situ observations objective analysis',
'MO_INSITU_GLO_PHY_UV_DISCRETE_NRT_013_048, Global Ocean- in-situ Near real time observations of ocean currents',
'MO_MULTIOBS_GLO_BGC_NUTRIENTS_CARBON_PROFILES_MYNRT_015_009, Nutrient and carbon profiles vertical distribution',
'MO_MULTIOBS_GLO_BIO_BGC_3D_REP_015_010, Global Ocean 3D Chlorophyll-a concentration, Particulate Backscattering coefficient and Particulate Organic Carbon',
'MO_MULTIOBS_GLO_BIO_CARBON_SURFACE_MYNRT_015_008, Global Ocean Surface Carbon',
'MO_MULTIOBS_GLO_PHY_MYNRT_015_003, Global Total (COPERNICUS-GLOBCURRENT), Ekman and Geostrophic currents at the Surface and 15m',
'MO_MULTIOBS_GLO_PHY_S_SURFACE_MYNRT_015_013, Multi Observation Global Ocean Sea Surface Salinity and Sea Surface Density',
'MO_MULTIOBS_GLO_PHY_TSUV_3D_MYNRT_015_012, Multi Observation Global Ocean 3D Temperature Salinity Height Geostrophic Current and MLD',
'MO_MULTIOBS_GLO_PHY_W_3D_REP_015_007, Global Observed Ocean Physics 3D Quasi-Geostrophic Currents (OMEGA3D)',
'MO_OCEANCOLOUR_GLO_BGC_L3_MY_009_103, Global Ocean Colour (Copernicus-GlobColour), Bio-Geo-Chemical, L3 (daily) from Satellite Observations (1997-ongoing)',
'MO_OCEANCOLOUR_GLO_BGC_L3_MY_009_107, Global Ocean Colour Plankton and Reflectances MY L3 daily observations',
'MO_OCEANCOLOUR_GLO_BGC_L3_NRT_009_101, Global Ocean Colour (Copernicus-GlobColour), Bio-Geo-Chemical, L3 (daily) from Satellite Observations (Near Real Time)',
'MO_OCEANCOLOUR_GLO_BGC_L4_MY_009_104, Global Ocean Colour (Copernicus-GlobColour), Bio-Geo-Chemical, L4 (monthly and interpolated) from Satellite Observations (1997-ongoing)',
'MO_OCEANCOLOUR_GLO_BGC_L4_MY_009_108, Global Ocean Colour Plankton MY L4 monthly observations',
'MO_OCEANCOLOUR_GLO_BGC_L4_NRT_009_102, Global Ocean Colour (Copernicus-GlobColour), Bio-Geo-Chemical, L4 (monthly and interpolated) from Satellite Observations (Near Real Time)',
'MO_SEAICE_GLO_SEAICE_L4_NRT_OBSERVATIONS_011_001, Global Ocean - Arctic and Antarctic - Sea Ice Concentration, Edge, Type and Drift (OSI-SAF)',
'MO_SEAICE_GLO_SEAICE_L4_NRT_OBSERVATIONS_011_006, Global Ocean - High Resolution SAR Sea Ice Drift',
'MO_SEAICE_GLO_SEAICE_L4_REP_OBSERVATIONS_011_009, Global Ocean Sea Ice Concentration Time Series REPROCESSED (OSI-SAF)',
'MO_SEALEVEL_GLO_PHY_L4_NRT_008_046, GLOBAL OCEAN GRIDDED L4 SEA SURFACE HEIGHTS AND DERIVED VARIABLES NRT',
'MO_SEALEVEL_GLO_PHY_MDT_008_063, GLOBAL OCEAN MEAN DYNAMIC TOPOGRAPHY',
'MO_SST_GLO_SST_L3S_NRT_OBSERVATIONS_010_010, ODYSSEA Global Ocean - Sea Surface Temperature Multi-sensor L3 Observations',
'MO_SST_GLO_SST_L4_NRT_OBSERVATIONS_010_001, Global Ocean OSTIA Sea Surface Temperature and Sea Ice Analysis',
'MO_SST_GLO_SST_L4_REP_OBSERVATIONS_010_011, Global Ocean OSTIA Sea Surface Temperature and Sea Ice Reprocessed',
'MO_SST_GLO_SST_L4_REP_OBSERVATIONS_010_024, ESA SST CCI and C3S reprocessed sea surface temperature analyses',
'MO_WAVE_GLO_PHY_SPC_FWK_L3_NRT_014_002, Global Ocean L 3 Spectral Parameters From Nrt Satellite Measurements',
'MO_WAVE_GLO_PHY_SWH_L3_NRT_014_001, GLOBAL OCEAN L3 SIGNIFICANT WAVE HEIGHT FROM NRT SATELLITE MEASUREMENTS',
'MO_WAVE_GLO_PHY_SWH_L4_NRT_014_003, GLOBAL OCEAN L4 SIGNIFICANT WAVE HEIGHT FROM NRT SATELLITE MEASUREMENTS',
'MO_WIND_GLO_PHY_CLIMATE_L4_MY_012_003, Global Ocean Monthly Mean Sea Surface Wind and Stress from Scatterometer and Model',
'MO_WIND_GLO_PHY_L3_MY_012_005, Global Ocean Daily Gridded Reprocessed L3 Sea Surface Winds from Scatterometer',
'MO_WIND_GLO_PHY_L3_NRT_012_002, Global Ocean Daily Gridded Sea Surface Winds from Scatterometer',
'MO_WIND_GLO_PHY_L4_MY_012_006, Global Ocean Hourly Reprocessed Sea Surface Wind and Stress from Scatterometer and Model',
'MO_WIND_GLO_PHY_L4_NRT_012_004, Global Ocean Hourly Sea Surface Wind and Stress from Scatterometer and Model',
'MSG_AMVR02, Atmospheric Motion Vectors Climate Data Record Release 2 - MFG and MSG - 0 degree',
'MSG_CLM, Cloud Mask - MSG - 0 degree',
'MSG_CLM_IODC, Cloud Mask - MSG - Indian Ocean',
'MSG_GSAL2R02, GSA Level 2 Climate Data Record Release 2 - MFG and MSG - 0 degree',
'MSG_HRSEVIRI, High Rate SEVIRI Level 1.5 Image Data - MSG - 0 degree',
'MSG_HRSEVIRI_IODC, High Rate SEVIRI Level 1.5 Image Data - MSG - Indian Ocean',
'MSG_LSA_FRM, Fire Risk Map - Released Energy Based - MSG',
'MSG_LSA_LSTDE, Land Surface Temperature with Directional Effects - MSG',
'MSG_LSA_LST_CDR, Land Surface Temperature Climate Data Record - MSG',
'MSG_MSG15_RSS, Rapid Scan High Rate SEVIRI Level 1.5 Image Data - MSG',
'MSG_RSS_CLM, Rapid Scan Cloud Mask - MSG',
'S1_SAR_GRD, SENTINEL1 Level-1 Ground Range Detected',
'S1_SAR_SLC, SENTINEL1 Level-1 Single Look Complex',
'S2_MSI_L1C, SENTINEL2 Level-1C',
'S2_MSI_L2A, SENTINEL2 Level-2A',
'S3_EFR, SENTINEL3 EFR',
'S3_ERR, SENTINEL3 ERR',
'S3_LAN, SENTINEL3 SRAL Level-2 LAN',
'S3_OLCI_L2LFR, SENTINEL3 OLCI Level-2 Land Full Resolution',
'S3_OLCI_L2LRR, SENTINEL3 OLCI Level-2 Land Reduced Resolution',
'S3_OLCI_L2WFR, SENTINEL3 OLCI Level-2 Water Full Resolution',
'S3_OLCI_L2WRR, SENTINEL3 OLCI Level-2 Water Reduced Resolution',
'S3_SLSTR_L1RBT, SENTINEL3 SLSTR Level-1',
'S3_SLSTR_L2AOD, SENTINEL3 SLSTR Level-2 AOD',
'S3_SLSTR_L2FRP, SENTINEL3 SLSTR Level-2 FRP',
'S3_SLSTR_L2LST, SENTINEL3 SLSTR Level-2 LST',
'S3_SLSTR_L2WST, SENTINEL3 SLSTR Level-2 WST',
'S3_SRA, SENTINEL3 SRAL Level-1',
'S3_SRA_A, SENTINEL3 SRAL Level-1 SRA_A',
'S3_SRA_BS, SENTINEL3 SRAL Level-1 SRA_BS',
'S3_WAT, SENTINEL3 SRAL Level-2 WAT',
'S5P_L1B_IR_ALL, Sentinel-5 Precursor Level 1B Irradiances for the SWIR and UNV bands',
'S5P_L2_IR_ALL, Sentinel-5 Precursor Level 2 Data',
'SATELLITE_CARBON_DIOXIDE, Carbon dioxide data from 2002 to present derived from satellite observations',
'SATELLITE_METHANE, Methane data from 2003 to present derived from satellite observations',
'SATELLITE_SEA_ICE_CONCENTRATION, Sea ice concentration daily gridded data from 1978 to present derived from satellite observations',
'SATELLITE_SEA_ICE_EDGE_TYPE, Sea ice edge and type daily gridded data from 1978 to present derived from satellite observations',
'SATELLITE_SEA_ICE_THICKNESS, Sea ice thickness monthly gridded data for the Arctic from 2002 to present derived from satellite observations',
'SATELLITE_SEA_LEVEL_GLOBAL, Sea level gridded data from satellite observations for the global ocean',
'SEASONAL_MONTHLY_PL, Seasonal forecast monthly statistics on pressure levels',
'SEASONAL_MONTHLY_SL, Seasonal forecast monthly statistics on single levels',
'SEASONAL_ORIGINAL_PL, Seasonal forecast subdaily data on pressure levels',
'SEASONAL_ORIGINAL_SL, Seasonal forecast daily and subdaily data on single levels',
'SEASONAL_POSTPROCESSED_PL, Seasonal forecast anomalies on pressure levels',
'SEASONAL_POSTPROCESSED_SL, Seasonal forecast anomalies on single levels',
'SIS_HYDRO_MET_PROJ, Temperature and precipitation climate impact indicators from 1970 to 2100 derived from European climate projections',
'UERRA_EUROPE_SL, UERRA regional reanalysis for Europe on single levels from 1961 to 2019']
Search
To search we use the search method passing the ID of our dataset of interest and a geo-time filter.
The search method returns a SearchResult object that stores the products obtained from a given page (default: page=1) and a given maximum number of items per page (default: items_per_page=20). The search_all() method can be used instead.
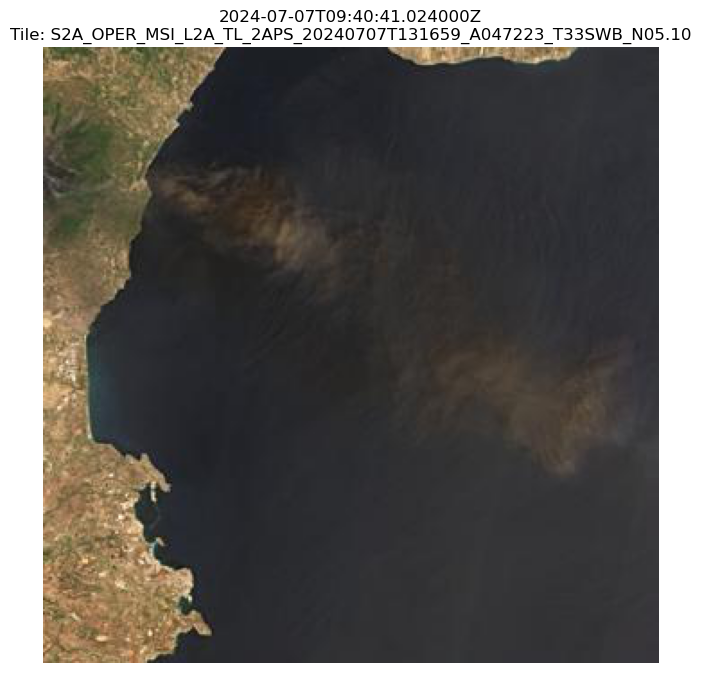
In the following cell, we change the default value of items_per_page and define the search criteria to retrieve Sentinel-2 MSI Level-2 images over Sicily, first days of July 2024. Our goal is to check whether any effects of Mount Etna’s eruptions during that period are visible in the Sentinel-2 imagery.
search_criteria = {
"provider":"dedl",
"productType": "EO.ESA.DAT.SENTINEL-2.MSI.L2A",
"start": "2024-07-04T07:00:00.00Z",
"end": "2024-07-08T07:00:00.00Z",
"geom": {"lonmin": 12, "latmin": 37, "lonmax": 16, "latmax": 39},
"count": True,
"items_per_page": 50
}
products_first_page = dag.search(**search_criteria)
Results are stored in a ‘SearchResult’ object that contains the details on the single search result.
products_first_page
It is possible to list the metadata associated with a certain product, we choose the first one returned [0], and look into it.
one_product = products_first_page[0]
one_product.properties.keys()
dict_keys(['abstract', 'instrument', 'platform', 'platformSerialIdentifier', 'processingLevel', 'keywords', 'sensorType', 'license', 'title', 'missionStartDate', 'productType', 'publicationDate', 'orbitNumber', 'cloudCover', 'modificationDate', 'sensorMode', 'startTimeFromAscendingNode', 'completionTimeFromAscendingNode', 'id', 'downloadLink', 'thumbnail', 'storageStatus', 'defaultGeometry', 'quicklook', 'providers', 'start_datetime', 'sat:absolute_orbit', 'sar:product_type', 'dedl:processorVersion', 'dedl:granuleIdentifier', 'dedl:tileIdentifier', 'dedl:sourceProduct', 'dedl:productGroupId', 'dedl:uid', 'dedl:origin', 'dedl:sourceProductOriginDate', 'dedl:endingDateTime', 'dedl:beginningDateTime', 'dedl:datastripId', 'dedl:scope'])
one_product.properties['cloudCover']
0.000265
Filter
EODAG can filter the search result. We can then refine our initial search without asking the provider again. Products can be filtered according to their properties or also with finer geometry filters.
The following example shows how to filter products to keep only those whose cloud coverage is less than 20%. And then restrict the results to products containing a smaller area over the mount Etna.
Let’s define now a smaller area around the mount Etna and a function to see the area on a map together with the results
from eodag.crunch import FilterProperty
from eodag.crunch import FilterOverlap
import shapely
import folium
from shapely.geometry import Polygon
small_geom = Polygon([[15.1, 37.7], [15.5, 37.7], [15.1, 37.75], [15.1, 37.75], [15.1, 37.7]])
smaller_area = {"lonmin": 15.1, "latmin": 37.7, "lonmax": 15.5, "latmax": 37.75}
search_geometry = shapely.geometry.box(
smaller_area["lonmin"],
smaller_area["latmin"],
smaller_area["lonmax"],
smaller_area["latmax"],
)
def create_search_result_map(search_results, extent):
"""Small utility to create an interactive map with folium
that displays an extent in red and EO Producs in blue"""
fmap = folium.Map([38, 14], zoom_start=7)
folium.GeoJson(
extent,
style_function=lambda x: dict(color="red")
).add_to(fmap)
folium.GeoJson(
search_results
).add_to(fmap)
return fmap
# Crunch the results
filtered_results = products_first_page.crunch(FilterProperty({"cloudCover": 20, "operator" : "lt"}))
print(f"Got now {len(filtered_results)} products after filtering by cloudCover.")
Got now 22 products after filtering by cloudCover.
filtered_products = filtered_results.crunch(
FilterOverlap(dict(contains=True)),
geometry=small_geom
)
print(f"Got now {len(filtered_products)} products after filtering by geometry.")
Got now 1 products after filtering by geometry.
Let’s use the function defined to see the area defined on a map (red) together with the initial results (blue) filtered by cloud coverage and geometry (green).
fmap = create_search_result_map(products_first_page, search_geometry)
# Create a layer that represents the filtered products in green
folium.GeoJson(
filtered_products,
style_function=lambda x: dict(color="green")
).add_to(fmap)
fmap
Download
Before downloading any product, it can be useful to have a quick look at them.
import matplotlib.pyplot as plt
import matplotlib.image as mpimg
quicklooks_dir = os.path.join(workspace, "quicklooks")
if not os.path.isdir(quicklooks_dir):
os.mkdir(quicklooks_dir)
fig = plt.figure(figsize=(20, 40))
for i, product in enumerate(filtered_products, start=1):
# This line takes care of downloading the quicklook
quicklook_path = product.get_quicklook()
img = mpimg.imread(quicklook_path)
ax = fig.add_subplot(8, 2, i)
ax.set_title(product.properties['dedl:beginningDateTime'] + "TILE: " +product.properties['dedl:tileIdentifier'])
plt.imshow(img)
plt.tight_layout()
The quicklook shows effectively the ash plume caused by the eruptions.
EOProducts can be downloaded individually. The last image is going to be downloaded.
product_to_download = filtered_products[-1]
product_path = dag.download(product_to_download)
product_path
The location property of this product now points to a local path.
product_to_download.location
'file:///home/jovyan/dev-branch/DestinE-DataLake-Lab/HDA/EODAG/eodag_workspace/S2A_MSIL2A_20240707T094041_N0510_R036_T33SWB_20240707T131659'